 Client Login

Equities Ratings Uptick
Investing Environment Review and Outlook – Volume 53
Equities Ratings Uptick
Last month we discussed the synchronized global economic slowdown, and the mixed implications for equities in particular, with a 5-10% potential decline before November. In September, the S&P 500 declined 5.1% from the peak. Today the world economy remains mixed with 67% of foreign economies weaker in September than August. This month we discuss the economy, the Federal Reserve, seasonality, inflation and market action to explain why we shifted equities and bond ratings.
This month we raised U.S. equities to a bullish 5 rating from a moderate 3 rating since July. Additionally, we raised Foreign Developed equities to a bullish 5 rating. Emerging Markets remain a bullish 4. We cut bonds to a cautious 2 rating. Commodities remain a neutral 3 and gold remains a bullish 5.
Strong Economy + Loose Fed + Q4: Bullish
This review and outlook report by Brenton Point Wealth Advisors LLC represents our views and beliefs regarding the current market outlook. Please also read the important disclosures at the end of this report.
Despite the mixed world economy, the uptick in the September ISM release showed the U.S. economy is quite strong at 61.1, in the 99th percentile of readings since 1990. Historically, stocks returned 21% when the economy was this strong and the Federal Reserve was loose, one of the most fundamental and consistently bullish set of conditions for stocks back to 1950.
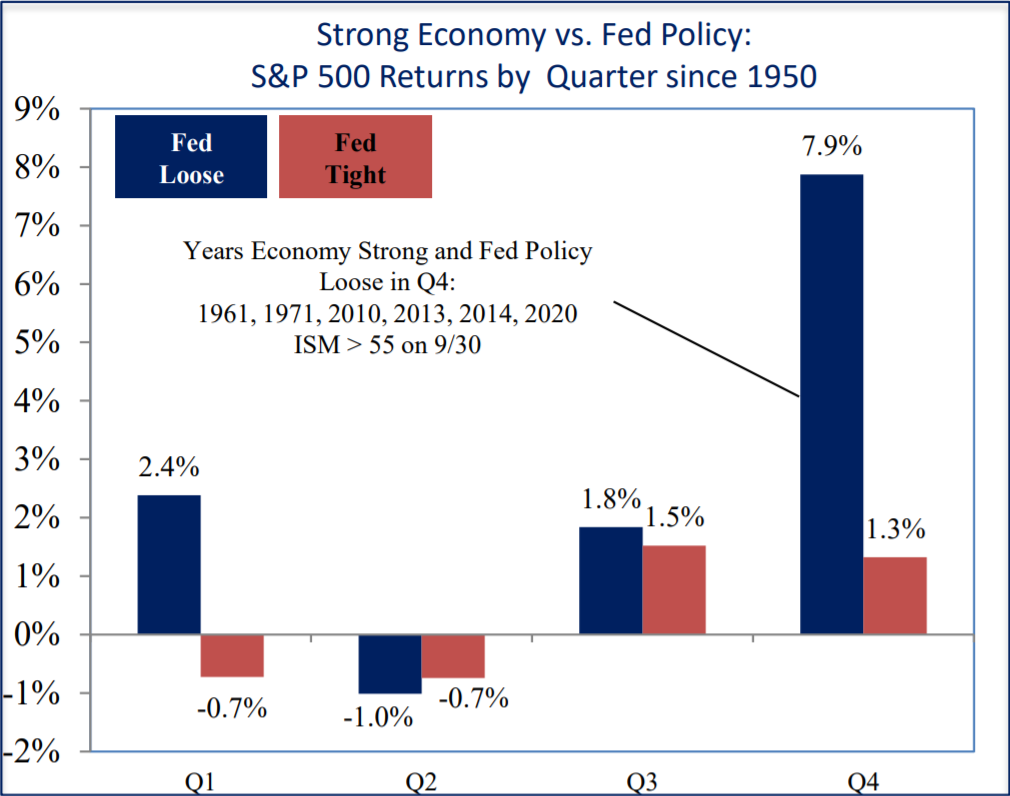
Today we have an additional strong tendency of positive equity returns during the fourth quarter from October to December. Since 1950 there were 6 comparable years (1961, 1971, 2010, 2013, 2014 and 2020). Q4 was up in all 6 of those years an average of 7.9%. Cases of Q3 with similar conditions were positive but returned a lower 1.8% on average.
September Decline Reversed Investor Positioning: Bullish for Equities
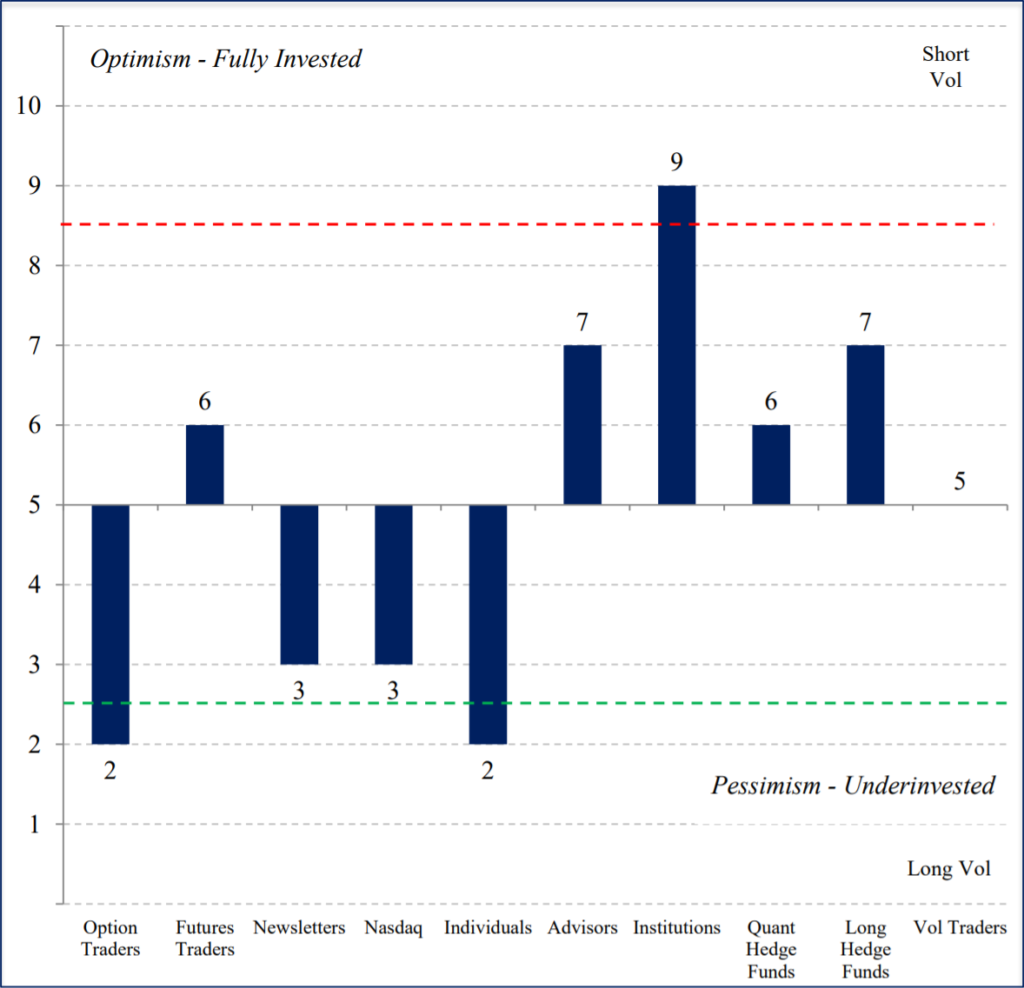
The 4.7% decline in the month of September was effective in dampening the extreme investor positioning from July and August that made us more cautious. For instance half of the 10 investor groups we follow are now below their norm, indicating cash available on the sidelines to drive equities higher. There was no shortage of negative headlines recently to make investors nervous, but September’s decline was bullish historically. In the 10 prior years since 1970 when September was down and the Fed was loose, the S&P was up 3 months out an average of 7.7%, 3x the norm.
Equity Investor Positioning Neutral After September Decline
Tapering is NOT Tightening
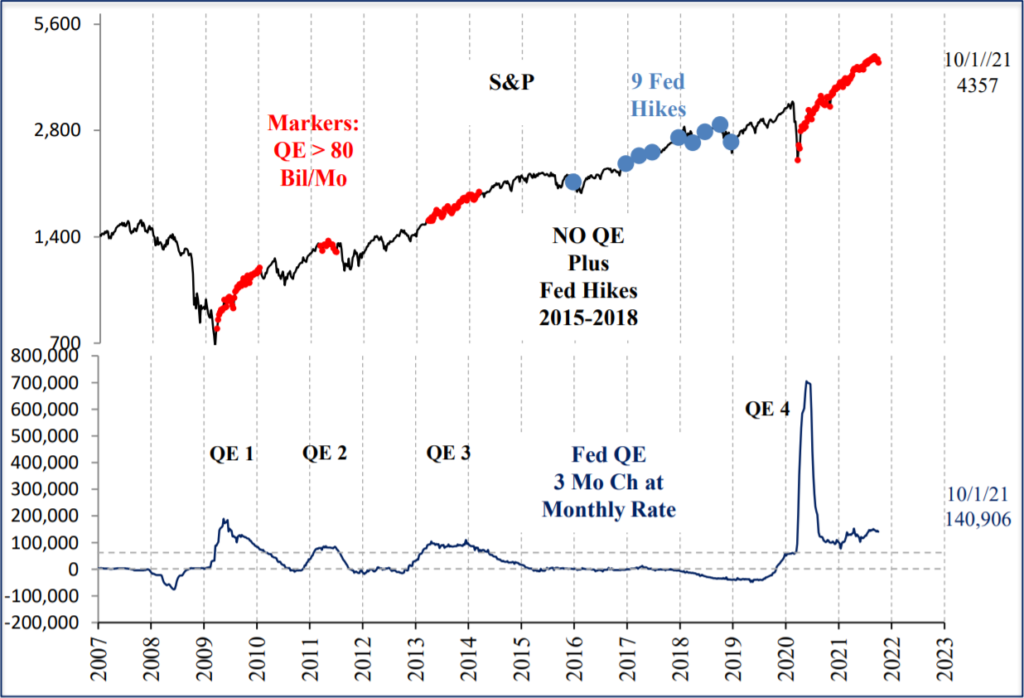
After months of speculation, at last month’s FOMC meeting the Fed signaled they will begin tapering QE in November, meaning they will decrease the amount of bonds they purchase each month from the current rate of $120 billion. The September equity decline resulted in more negative predictions in the media as usual, with some concluding that tapering is in fact tightening and, therefore, bearish for equities.
However, the record shows quite the opposite. Since 2010 the S&P 500 returned 44% annualized, or 3x the norm, when the QE rate was over 80 billion per month and falling. The fact is we already saw a tapering of the initial COVID QE in May 2020 from $800 billion a month to $120 billion since then with no downside effect on equity returns.
Even if we assume it is, in fact, a Fed tightening, the implications are more positive for equities than investors might expect. People forget not only that the Fed hiked 9 times to 2.5% from 2015 to 2018, but the S&P 500 rallied 29.7% between the first and last hike. The pattern is surprisingly similar in prior cycles as well. The S&P 500 rallied an average of 7.4% 3 months prior to the 15 initial hikes since 1946 and another 3.9% 3 months later. All but one was higher a year later, an average of 11.5%.
Tapering is NOT Tightening: 4 Fed QE Cycles 2010-2021
Inflation Outlook Remains Up: Higher Interest Rates Ahead
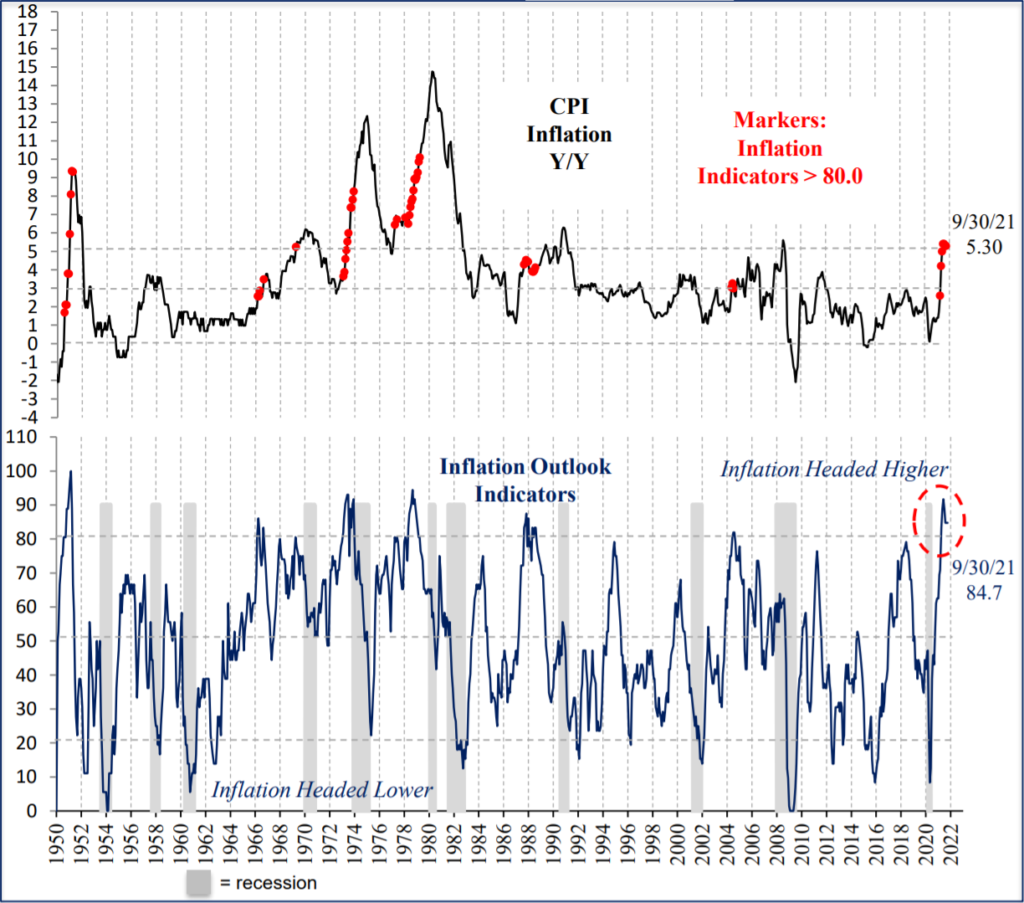
Inflation outlook indicators remained elevated in September, putting pressure on the Fed’s “transitory” inflation narrative. After declining in August, delivery times reversed higher in September, suggesting supply bottlenecks are not clearing as expected. This year might be unique, but prior sharp inflation moves like 1974, 1979, 1990 and 2007 only reversed lower after a recession hit, usually caused by Fed hiking rates over the inflation rate. In contrast, today the Fed Funds rate is 5% BELOW inflation. Since August market expectations for Fed Funds are up, but still below 2%, even for 2025. We moved our bond rating to a bearish 2 because bond yields may have a long way to go on the upside, despite the neutral economic outlook. Surprisingly, a strong inflation outlook combined with a loose Fed is bullish for equities historically with a 40.6% annualized return, or 4x the norm. A tight Fed and rising inflation is a negative combination for equity returns as you might expect, and one we are watching closely.
Inflation Outlook Extreme: 3-5% Inflation Ahead
Summary
Investment conditions today are as complex and noisy as ever. However, the combination of a strong U.S. economy, a loose Federal Reserve, and the fourth quarter of the year gives bulls the edge for upside at least through year end. The persistent inflation readings and the elevated inflation outlook mean there is more risk to the upside for interest rates, and downside for bond prices. If interest rates continue higher, eventually that will certainly present a downside risk for equities. Thank you for your support and please contact your advisor with any questions.
IMPORTANT DISCLOSURES
This review and outlook report (this “Report”) is for informational, illustration and discussion purposes only and is not intended to be, nor should it be construed as, financial, legal, tax or investment advice, of Brenton Point Wealth Advisors LLC or any of its affiliates (“Brenton Point”). This Report does not take into account the investment objectives, financial situation, restrictions, particular needs or financial, legal or tax situation of any particular person and should not be viewed as addressing any recipient’s particular investment needs. Recipients should consider the information contained in this Report as only a single factor in making an investment decision and should not rely solely on investment recommendations contained herein, if any, as a substitution for the exercise of independent judgment of the merits and risks of investments.
This material is based upon information obtained from various sources that Brenton Point believes to be reliable, but Brenton Point makes no representation or warranty with respect to the accuracy or completeness of such information. Views expressed herein are current only as of the date indicated and are subject to change without notice.
This Report contains certain forward looking statements opinions, estimates, projections, assessments and other views (collectively “Statements”). These Statements are subject to a number of assumptions, risks and uncertainties which may cause actual results, performance or achievements to be materially different from future results, performance or achievements expressed or implied by these forward looking statements and projections. Brenton Point makes no representations as to the reasonableness of such assumptions or the likelihood that such assumptions will coincide with actual events and this information should not be relied upon for that purpose. Changes in such assumptions could produce materially different results. Past performance is not a guarantee or indication of future results, and no representation or warranty, express or implied, is made regarding future performance of any financial instrument mentioned in this Report.
Any benchmark shown herein is shown for illustrative purposes only. No index benchmark is available for direct investment. It may not be possible to replicate the returns of any index, as the index may not include any trading commissions and costs or fees, may assume the reinvestment of income, and may have investment objectives, use trading strategies, or have other materials characteristics, such as credit exposure or volatility, that do not make it suitable for a particular person. This is not an offer or solicitation for the purchase or sale of any security, investment, or other product and should not be construed as such. References to specific financial instruments and to certain indices are for illustrative purposes only and provided for the purpose of making general market data available as a point of reference only; they are not intended to be, and should not be interpreted as recommendations to purchase or sell such securities. Investing in securities and other financial products entails certain risks, including the possible loss of the entire principal amount invested, as the value of investment can go down as well as up. You should obtain advice from your tax, financial, legal, and other advisors and only make investment decisions on the basis of your own objectives, experience, and resources.
Brenton Point accepts no liability for any loss (whether direct, indirect or consequential) occasioned to any person acting or refraining from action as a result of any material contained in or derived from this Report, except to the extent (but only to the extent) that such liability may not be waived, modified or limited under applicable law.
This Report may provide addresses of, or contain hyperlinks to, Internet websites. Brenton Point has not reviewed the linked Internet website of any third party and takes no responsibility for the contents thereof. Each such address or hyperlink is provided solely for your convenience and information, and the content of linked third party websites is not in any way incorporated herein. Recipients who choose to access such third-party websites or follow such hyperlinks do so at their own risk.
All marks referenced herein are the property of their respective owners. This Report is licensed for non-commercial use only, and may not be reproduced, distributed, forwarded, posted, published, transmitted, uploaded or otherwise made available to others for commercial purposes, including to individuals within an institution, without written authorization from Brenton Point.
Source of data and performance statistics: Bloomberg L.P. and Factset Research Systems Inc.
©Brenton Point Wealth Advisors LLC 2021

Michael Schaus
Director of Market Research
Michael Schaus is the Director of Market Research for Brenton Point Wealth Advisors and Zweig-DiMenna. Since joining Zweig-DiMenna in 1992, his focus has been on macroeconomic research, the analysis of…
READ MORE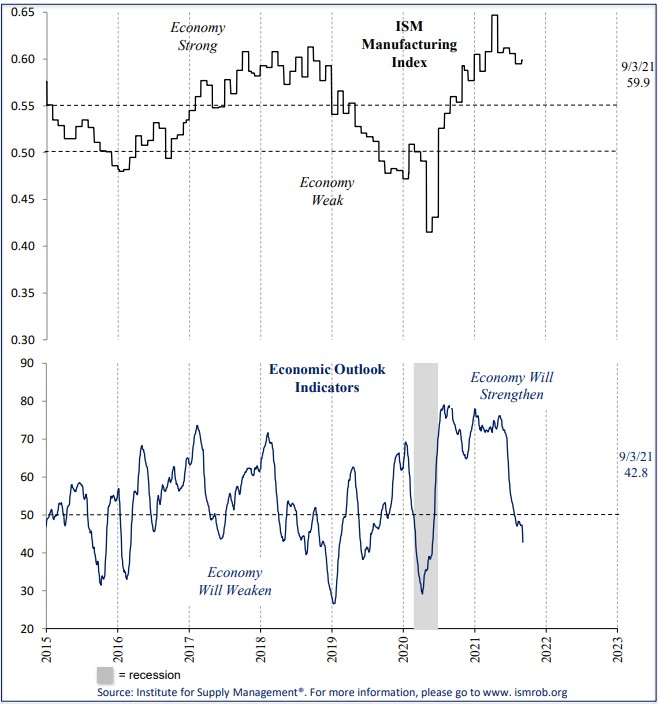
Sign up!
Sign up for our monthly newsletter and get the lastest news and research from our esteemed advisors here at Brenton point. Right into your inbox!