 Client Login

October to April: Best Seasonal Period of the Year
The latest news headlines are full of potential market risks. Election politics, recession, layoffs, delayed fiscal stimulus, a rise in COVID‐19 cases, and now Trump is infected with COVID. The wall of worry is certainly intact. Despite the multitude of daily news distractions, our research tells us a committed Federal Reserve, low inflation , and a positive economic outlook mean there is more risk to the upside for equities than downside, particularly in the fourth quarter. The significant rebound in the ISM Manufacturing Index to 55 signals a more mature stage of the economic cycle, which has historically meant lower equity volatility ahead. This month we discuss the nearly 10% September decline in the S&P 500, the long history of positive seasonality from October to April, and the biggest investor concern: the presidential election. Equity ratings remain bullish 5’s along with commodities and gold. Long‐term bonds remain at a cautious 1, due to the high probability that long‐term rates will move higher.
October to April: Best Seasonal Period of the Year
October 1st marked the start of the best seasonal period of the year for equities historically. Since 1950, the S&P 500 returned an average of 7.7% and was up 77% of the time during those months. This contrasts with May to September, which averages just 1.0% and is up 66% of the time. The October‐April period lead the May to September period in every decade since 1950, so it’s been consistent over time, as well. Even since 2010, returns were 9.2% and 2.0% respectively, similar to the norm. The fourth quarter alone is also positive, averaging a 3.9% return since 1950, and higher 78% of the time, despite some sharp declines like ‐14% in 2018 and ‐22.6% in 2008 during the Global Financial Crisis.
Chart 1: The Oct – April Period (Blue) for the S&P 500 Lead May – Sept Period (Red)In Every Decade Since 1950

Chart 2: Historically, October to April is Best Period of the YearS&P 500 Returns Since 1950

‐9.6% Equity Decline in September: Normal Bull Market Reversal
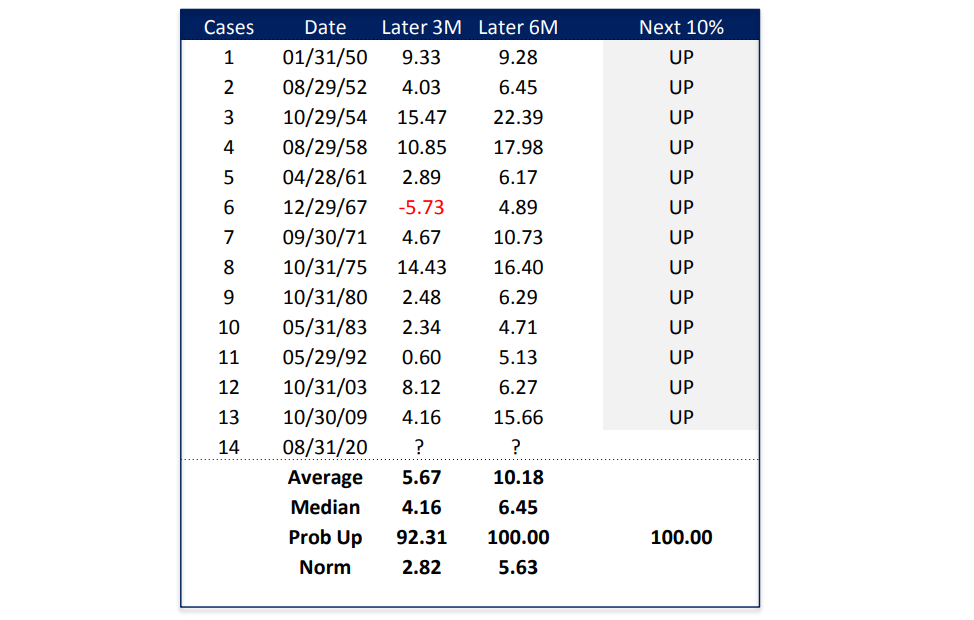
From September 2nd through September 23rd the S&P 500 declined 9.6%, a standard bull market correction. Just since 2010, there have been 10 declines over 8%, and only 3 of those (2011, 2018, and 2020) declined over 15%. With our general long‐term focus on capital preservation, we are primarily concerned with cyclical bear markets, which can do the most damage to portfolios. In contrast, during normal bull market reversals like we saw in September, when fundamental indicators were positive, it is most important to hold positions. These declines help to extend bull markets by cutting speculation. You can see that in investor positioning changes. Of the 10 groups we follow, 6 of them became more bearish during the September decline, raising cash that will drive the next leg higher. In fact, after 8% declines, the S&P 500 returned 42.9% annualized in the fourth quarter, with 79% of cases higher (4x the norm). That compares to a 13.1% annualized return after 8% rallies. This is one case where a weaker tape is a positive.
Chart 3: S&P 500 Down 9.6% on 9/23: Normal Bull Market ReversalMax 1 Mo Declines Since 2010

Chart 4: Equity Investor Positioning: More Favorable Compare Recent S&P 500 Peak vs. Low on 9/23/20

November Election: Contested Election Risk Lower
An ISI Evercore weekly survey showed the election overtook the COVID‐19 pandemic to become the number one investor concern on August 7th. With a surge in voting by mail this year to 33% of voters from a norm of 18%, the biggest concern was a contested election resulting in an unknown delay to determine a winner. This was true particularly before the first debate, when there was no clear leader. However, after the debate, polls showed a significant jump in Biden’s lead. With a bigger lead, the contested election risk declined, and equity markets rallied. In August, we reviewed election year history showing mixed returns, as investors focused on the election in September and October (‐0.8%/53% up) and more consistent positive returns after the election in November and December (2.7%/76% up), regardless of the outcome. This year is certainly different than most but so far, the market is following the same pattern.
Chart 5: ISI Survey: Biggest Market Risk Election Overtook COVID-19

Chart 6: Predictit.org Betting Market: Biden 69% Odds to Win Contested Election Less Likely after First Debate

Summary
We focus on the most predictive conditions for equity returns at every stage of the cycle. Today those include a committed Federal Reserve, low inflation, and a positive economic outlook‐-conditions which historically were followed by strong equity returns. The September decline in equities was typical of the mixed returns in the months prior to presidential elections. The decline was a positive since it resulted in more favorable investor positioning with more cash available to move equity indices higher. Finally, the October to April period is the strongest period of the year back to 1950. Equity, commodity, and gold ratings remain bullish 5’s this month and long‐term bonds remain at a cautious 1, due to the divergence in rates from commodities and equity indices. We are always sensitive to changing conditions and their implications for future asset returns, but our study of prior cycles leads us to believe the next significant downside risk will result from a stronger rather than weaker economy. Sustained economic strength is often followed by higher rates, investor exuberance, higher inflation, and a restrictive Federal Reserve. Thank you for your support and please contact your advisor with any questions.
IMPORTANT DISCLOSURES
This review and outlook report (this “Report”) is for informational, illustration and discussion purposes only and is not intended to be, nor should it be construed as, financial, legal, tax or investment advice, of Brenton Point Wealth Advisors LLC or any of its affiliates (“Brenton Point”). This Report does not take into account the investment objectives, financial situation, restrictions, particular needs or financial, legal or tax situation of any particular person and should not be viewed as addressing any recipient’s particular investment needs. Recipients should consider the information contained in this Report as only a single factor in making an investment decision and should not rely solely on investment recommendations contained herein, if any, as a substitution for the exercise of independent judgment of the merits and risks of investments.
This material is based upon information obtained from various sources that Brenton Point believes to be reliable, but Brenton Point makes no representation or warranty with respect to the accuracy or completeness of such information. Views expressed herein are current only as of the date indicated and are subject to change without notice.
This Report contains certain forward looking statements opinions, estimates, projections, assessments and other views (collectively “Statements”). These Statements are subject to a number of assumptions, risks and uncertainties which may cause actual results, performance or achievements to be materially different from future results, performance or achievements expressed or implied by these forward looking statements and projections. Brenton Point makes no representations as to the reasonableness of such assumptions or the likelihood that such assumptions will coincide with actual events and this information should not be relied upon for that purpose. Changes in such assumptions could produce materially different results. Past performance is not a guarantee or indication of future results, and no representation or warranty, express or implied, is made regarding future performance of any financial instrument mentioned in this Report.
Any benchmark shown herein is shown for illustrative purposes only. No index benchmark is available for direct investment. It may not be possible to replicate the returns of any index, as the index may not include any trading commissions and costs or fees, may assume the reinvestment of income, and may have investment objectives, use trading strategies, or have other materials characteristics, such as credit exposure or volatility, that do not make it suitable for a particular person. This is not an offer or solicitation for the purchase or sale of any security, investment, or other product and should not be construed as such. References to specific financial instruments and to certain indices are for illustrative purposes only and provided for the purpose of making general market data available as a point of reference only; they are not intended to be, and should not be interpreted as recommendations to purchase or sell such securities. Investing in securities and other financial products entails certain risks, including the possible loss of the entire principal amount invested, as the value of investment can go down as well as up. You should obtain advice from your tax, financial, legal, and other advisors and only make investment decisions on the basis of your own objectives, experience, and resources.
Brenton Point accepts no liability for any loss (whether direct, indirect or consequential) occasioned to any person acting or refraining from action as a result of any material contained in or derived from this Report, except to the extent (but only to the extent) that such liability may not be waived, modified or limited under applicable law.
This Report may provide addresses of, or contain hyperlinks to, Internet websites. Brenton Point has not reviewed the linked Internet website of any third party and takes no responsibility for the contents thereof. Each such address or hyperlink is provided solely for your convenience and information, and the content of linked third party websites is not in any way incorporated herein. Recipients who choose to access such third-party websites or follow such hyperlinks do so at their own risk.
All marks referenced herein are the property of their respective owners. This Report is licensed for non-commercial use only, and may not be reproduced, distributed, forwarded, posted, published, transmitted, uploaded or otherwise made available to others for commercial purposes, including to individuals within an institution, without written authorization from Brenton Point.
Source of data and performance statistics: Bloomberg L.P. and Factset Research Systems Inc.
©Brenton Point Wealth Advisors LLC 2020

Michael Schaus
Director of Market Research
Michael Schaus is the Director of Market Research for Brenton Point Wealth Advisors and Zweig-DiMenna. Since joining Zweig-DiMenna in 1992, his focus has been on macroeconomic research, the analysis of…
READ MORE
Sign up!
Sign up for our monthly newsletter and get the lastest news and research from our esteemed advisors here at Brenton point. Right into your inbox!