 Client Login

Commodities Rating Uptick
Investing Environment Review and Outlook – Volume 72
Commodities Rating Uptick
Last month we discussed the lower than expected debt ceiling event risk, deficit spending, and the end to positive presidential cycle seasonality. Since then, the equity market moved sharply higher into overbought territory led by technology stocks, with a parallel shift in investor positioning as usual. This month we discuss these new market conditions and the positive developments for commodities. U.S., foreign-developed and emerging markets equities remain bullish 5 ratings. Long-term bonds remain a neutral 3 rating. Gold remains a bullish 5 rating and industrial commodities up ticked to a bullish 5 rating.
Weak ISM Index: Bullish for Crude Oil
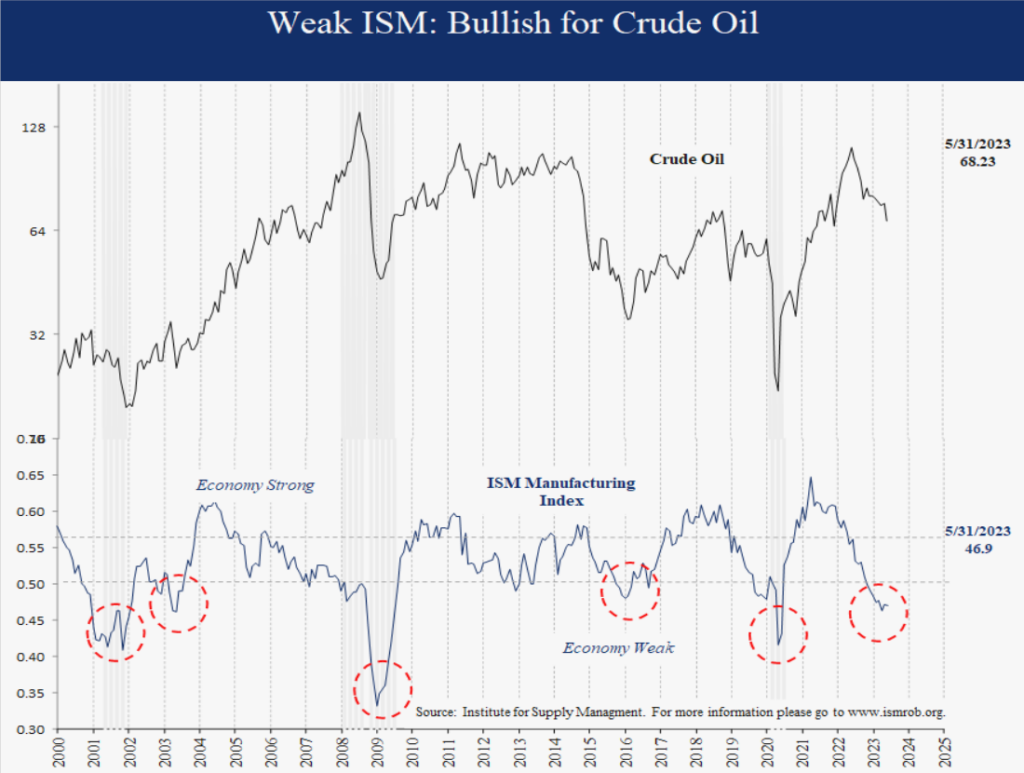
The ISM Index is the one of the best coincident economic indicators for the U.S. economy since it is timely, has decades of history, and is not revised. May’s reading of 46.9 was weak in the 12th percentile historically. Although a weakening economy is negative for industrial commodity prices like oil, an already weak economy is actually bullish. Since 1979 ISM readings below 50 were bullish for crude oil, particularly if they coincided with an economic turn to the upside. Today our economic outlook indicators are still neutral but have improved to 48.4 from 39 in May. Other positive signs for crude are stronger copper, CRB Industrials Index and natural gas prices. Finally, the weak dollar (down 2% in June and 10% since October) is also bullish for crude and most industrial commodities historically. For instance, since 1979 crude oil returned 32% annualized during Q3 when the dollar was weak.
S&P 500 Overbought: Lower Returns Ahead
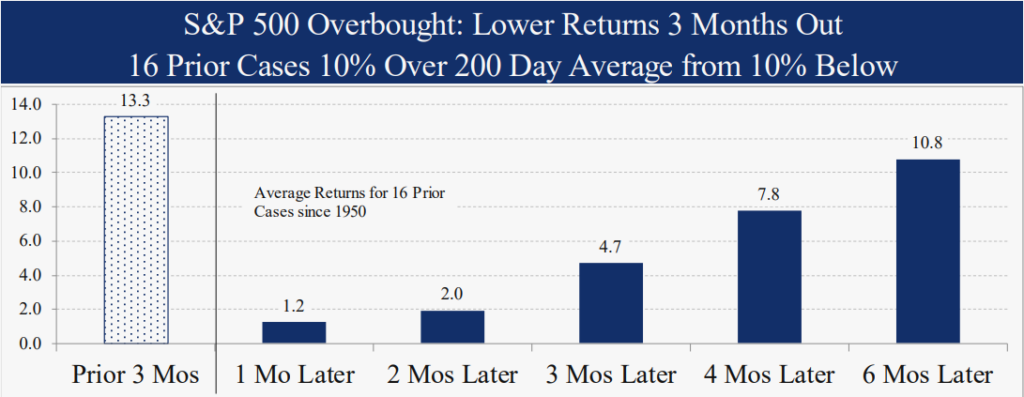
The S&P 500 is up 13.3% since the March 15th banking panic low, an extreme move to the upside. For perspective, the S&P 500 is 10.6% above the 200-day average in the 87th percentile as of 6/16. In other words, the market was only stronger 13% of the time historically. This is the mirror image from the October 12th low when the S&P 500 was 14% BELOW the 200-day average. In the 16 prior cases since 1950 when the S&P 500 rallied from 10% below the 200-day average to 10% above, average returns in the prior 3 months were similar at 13.3%, but forward returns were much lower at 1.2% a month out and 4.7% 3 months later. Investors expecting more of the same will likely be disappointed.

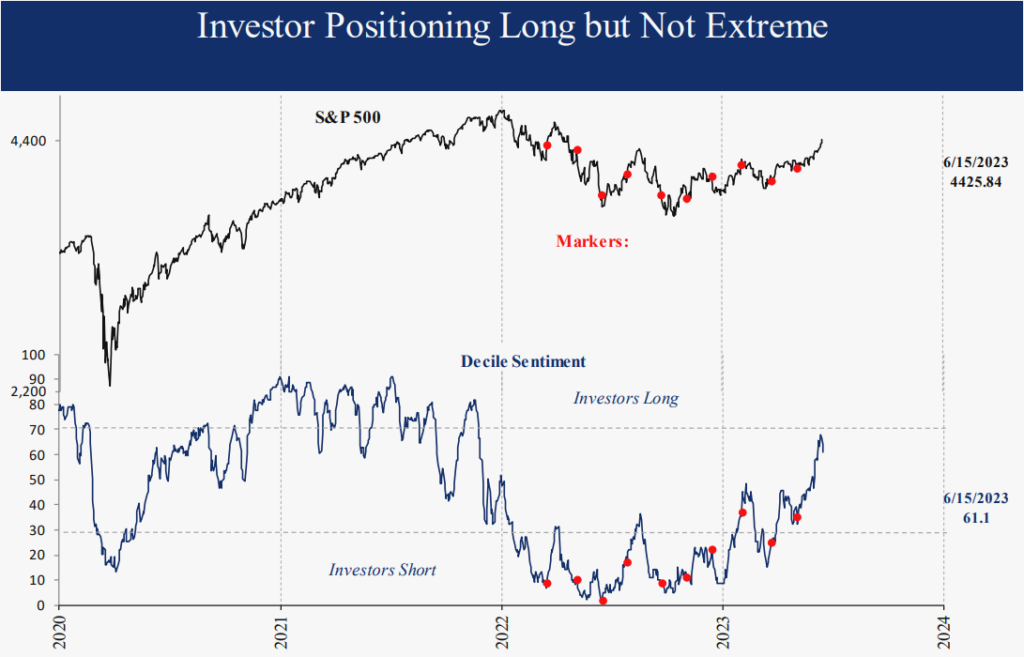
Investor Positioning: Shifted Long
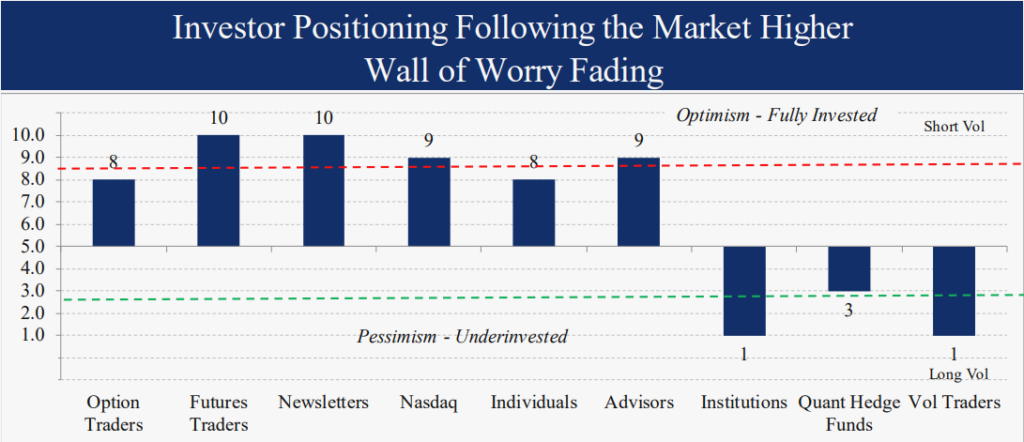
Equity investor positioning among the 9 groups we track shifted last week to net long for the first time since the S&P 500 October low. It was a testament to the strong wall of worry that it took 8 months and a 23% rally until investors were convinced. Like the overbought condition, there are no strong implications since positioning is not yet extreme with institutions and hedge funds still underinvested. Investors underinvested means liquidity available to drive stocks higher.
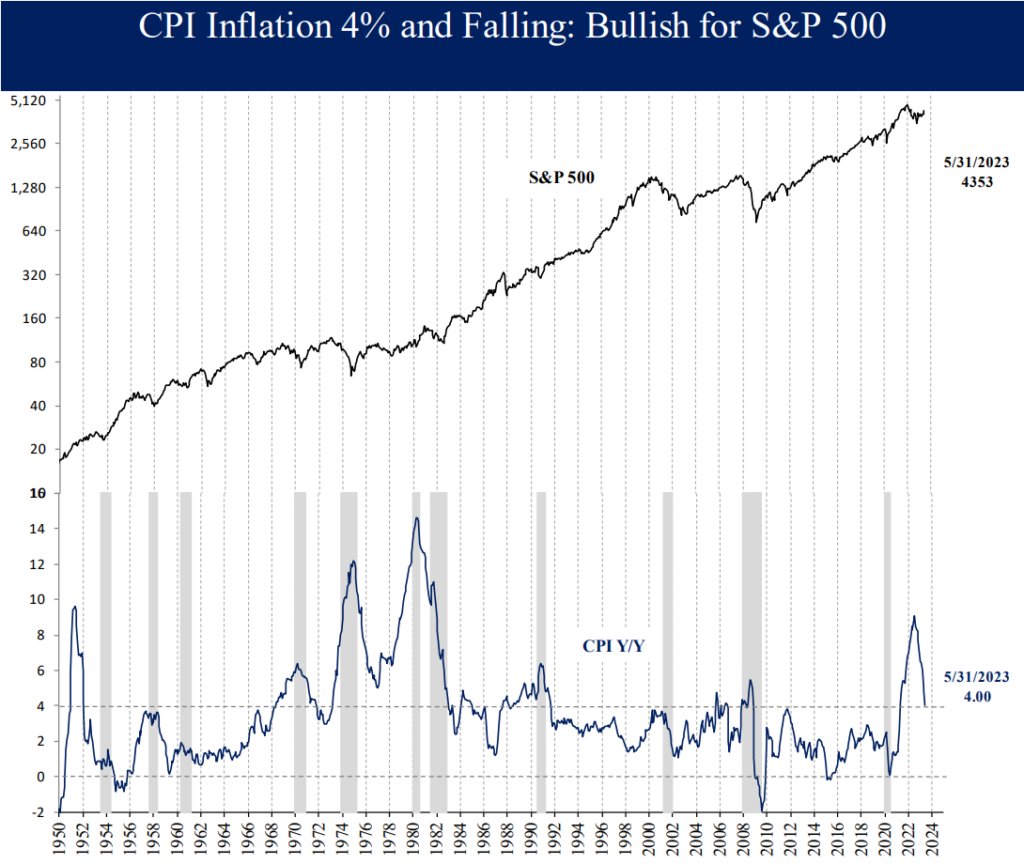
CPI Inflation 0-4% and Falling: Bullish for S&P 500
Headline CPI inflation reached 4% Y/Y in May, down from the 9.1% peak a year ago. The media and Fed focus on the higher core rate ex food and energy at 5.3% is misdirected, since historically core has been a valuable less volatile, but lagging inflation indicator. Our inflation outlook model has been an effective leading inflation indicator and continues to show a low reading of 38.1 for May, indicating lower inflation ahead. More importantly, CPI at 4% and falling was bullish for the S&P 500 consistently back to 1950, with a return of 18.8% vs. -1.2% when CPI was over 4% and rising as we saw in the first half of 2022 during the S&P 500 bear market. By focusing on the 2% inflation target level, investors are missing a much more simple, yet effective signal for equity returns.
Summary
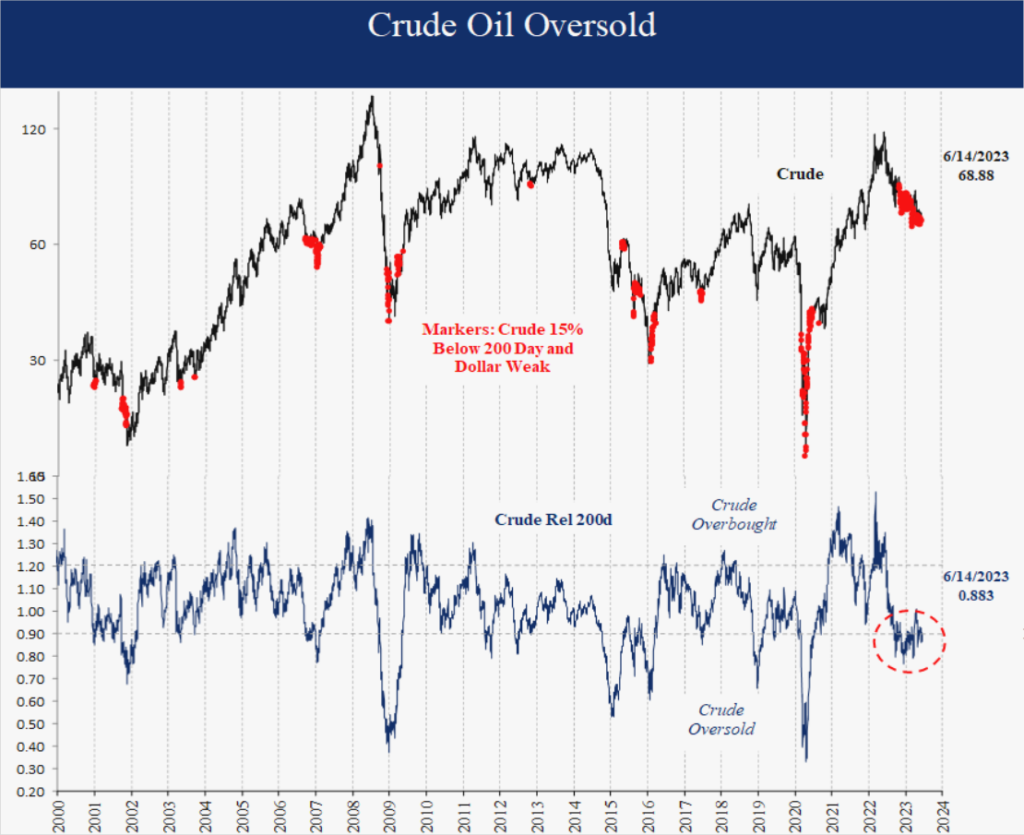
This month we discussed the commodity rating uptick based on a number of conditions like oversold crude oil, the weak dollar, the weak economy as measured by the ISM Manufacturing Index, and the recent turn in natural gas prices. Our economic outlook indicators remain neutral, but the recent 9-point improvement means a chance the economy is finally firming after a long post-Covid normalization. Equity indicators remain positive particularly with inflation now at 4% and falling, but conditions like seasonality and investor positioning are early signs downside risk is rising after the 8 month rally off the October low. We will continue to watch our indicators on a daily basis for changes. Thank you for your support and please contact us with any questions.
IMPORTANT DISCLOSURES
This review and outlook report (this “Report”) is for informational, illustration and discussion purposes only and is not intended to be, nor should it be construed as, financial, legal, tax or investment advice, of Brenton Point Wealth Advisors LLC or any of its affiliates (“Brenton Point”). This Report does not take into account the investment objectives, financial situation, restrictions, particular needs or financial, legal or tax situation of any particular person and should not be viewed as addressing any recipient’s particular investment needs. Recipients should consider the information contained in this Report as only a single factor in making an investment decision and should not rely solely on investment recommendations contained herein, if any, as a substitution for the exercise of independent judgment of the merits and risks of investments.
This material is based upon information obtained from various sources that Brenton Point believes to be reliable, but Brenton Point makes no representation or warranty with respect to the accuracy or completeness of such information. Views expressed herein are current only as of the date indicated and are subject to change without notice.
This Report contains certain forward looking statements opinions, estimates, projections, assessments and other views (collectively “Statements”). These Statements are subject to a number of assumptions, risks and uncertainties which may cause actual results, performance or achievements to be materially different from future results, performance or achievements expressed or implied by these forward looking statements and projections. Brenton Point makes no representations as to the reasonableness of such assumptions or the likelihood that such assumptions will coincide with actual events and this information should not be relied upon for that purpose. Changes in such assumptions could produce materially different results. Past performance is not a guarantee or indication of future results, and no representation or warranty, express or implied, is made regarding future performance of any financial instrument mentioned in this Report.
Any benchmark shown herein is shown for illustrative purposes only. No index benchmark is available for direct investment. It may not be possible to replicate the returns of any index, as the index may not include any trading commissions and costs or fees, may assume the reinvestment of income, and may have investment objectives, use trading strategies, or have other materials characteristics, such as credit exposure or volatility, that do not make it suitable for a particular person. This is not an offer or solicitation for the purchase or sale of any security, investment, or other product and should not be construed as such. References to specific financial instruments and to certain indices are for illustrative purposes only and provided for the purpose of making general market data available as a point of reference only; they are not intended to be, and should not be interpreted as recommendations to purchase or sell such securities. Investing in securities and other financial products entails certain risks, including the possible loss of the entire principal amount invested, as the value of investment can go down as well as up. You should obtain advice from your tax, financial, legal, and other advisors and only make investment decisions on the basis of your own objectives, experience, and resources.
Brenton Point accepts no liability for any loss (whether direct, indirect or consequential) occasioned to any person acting or refraining from action as a result of any material contained in or derived from this Report, except to the extent (but only to the extent) that such liability may not be waived, modified or limited under applicable law.
This Report may provide addresses of, or contain hyperlinks to, Internet websites. Brenton Point has not reviewed the linked Internet website of any third party and takes no responsibility for the contents thereof. Each such address or hyperlink is provided solely for your convenience and information, and the content of linked third party websites is not in any way incorporated herein. Recipients who choose to access such third-party websites or follow such hyperlinks do so at their own risk.
All marks referenced herein are the property of their respective owners. This Report is licensed for non-commercial use only, and may not be reproduced, distributed, forwarded, posted, published, transmitted, uploaded or otherwise made available to others for commercial purposes, including to individuals within an institution, without written authorization from Brenton Point.
Source of data and performance statistics: Bloomberg L.P. and Factset Research Systems Inc.
©Brenton Point Wealth Advisors LLC 2023

Michael Schaus
Director of Market Research
Michael Schaus is the Director of Market Research for Brenton Point Wealth Advisors and Zweig-DiMenna. Since joining Zweig-DiMenna in 1992, his focus has been on macroeconomic research, the analysis of…
READ MORE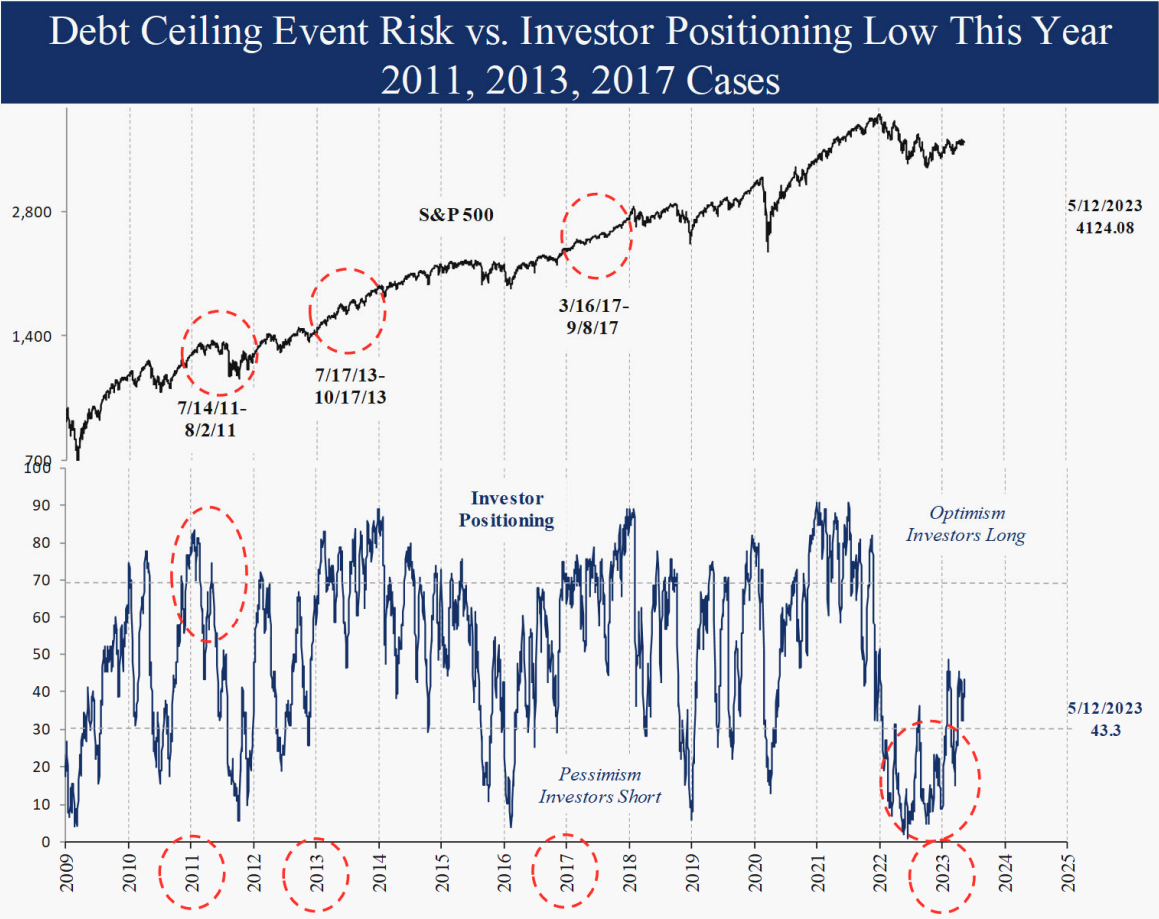
Sign up!
Sign up for our monthly newsletter and get the lastest news and research from our esteemed advisors here at Brenton point. Right into your inbox!