 Client Login

CPI Panic: Missing the Big Picture
Investing Environment Review and Outlook – Volume 80
- CPI Inflation Panic: Missing the Big Picture
- Economic Outlook Indicators Up: Bonds Rating Downtick to 1
- Natural Gas Meltdown: Inflection Point
- Dollar up 4%: Risk for Emerging Market Equities
Last month we discussed the mixed evidence for bonds, the myth of cash on the sidelines, and the opportunity in the Hang Seng Index collapse. Since then, bond indicators downticked with strong economic releases like the Philly Fed, higher commodity prices like copper, and generally stronger economic outlook indicators. This month we discuss the CPI inflation panic, the stronger economic outlook, a possible natural gas inflection point, and the risk to emerging market equities from the dollar strength. U.S. equities, foreign-developed and emerging markets equities remain bullish 5 ratings. Gold remains a bullish 5 rating and industrial commodities remain a bullish 4 rating. Longterm bonds downticked to a max bearish 1 rating.
CPI Panic: Missing the Big Picture
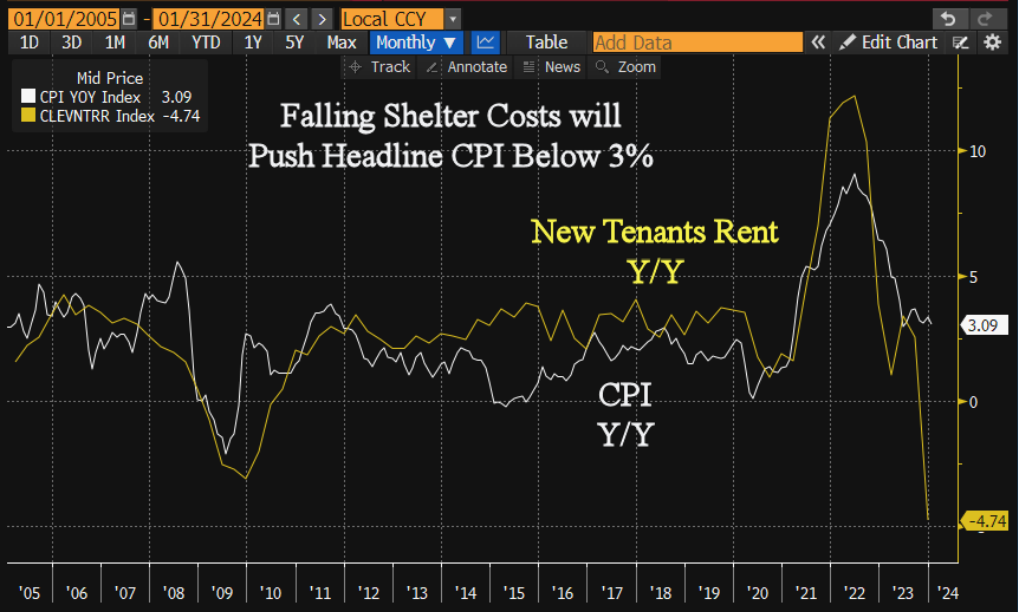
The stronger than expected CPI inflation released last week for January at 3.1% Y/Y down from 3.4% in December certainly cut back on expectations for Fed easing this year. Stronger than expected housing shelter costs are one reason CPI stalled in the last 6 months between 3.0 and 3.5%. The Cleveland Fed publishes a series called New Tenants Rent, which is currently down 4.7% Y/Y. This means the large shelter component of CPI will likely put downward pressure on CPI going forward. Combined with our inflation outlook model at a low reading of 37.5, it is likely CPI headline inflation will break below 3%.
What the Fed will do or whether inflation will hit the Fed’s 2% target are the wrong questions. What matters for the health and life expectancy of this economic cycle is the declining trend of inflation, down from the 9.1% 2022 peak and in line with prior inflation spike cases. Historically, the sequence is typically first, higher equities and long-term interest rates (which lead), economic acceleration, higher inflation (which lags), Fed hiking (also lagging), then eventually the equity bear market (which leads the economy), lower long-term interest rates, and finally, Fed easing once a recession is obvious. For now, goldilocks conditions of moderate growth and falling inflation are bullish for equities.
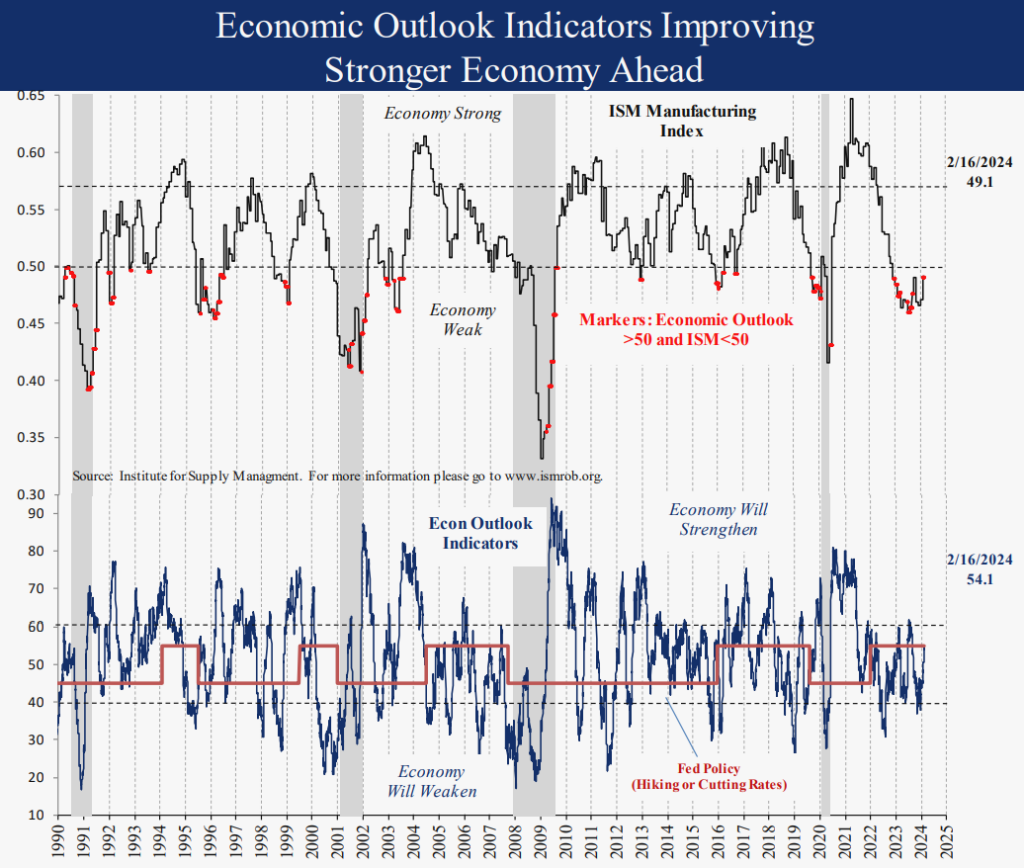
Economic Outlook Indicators 54.1: Stronger Economy Ahead
Our economic outlook indicators have improved from the recent low of 37 on 11/1/23 to 54 on 2/16/24 as leading indicators like equities, bond yields, and commodity prices have risen. The ISM Index is one of the best coincident economic indicators due to its long history, a timely release at the end of each month, and no major revisions like GDP or retail sales. In prior cases when our economic outlook indicators were above 50 and the ISM Index was below 50, the economy accelerated. The ISM Index is already up 3 points to 49.1 from the recent low of 46.0 in June. It is likely to continue higher. This is the primary reason we are cutting the long-term bond rating to a max cautious 1. Higher longterm rates mean lower bond prices.
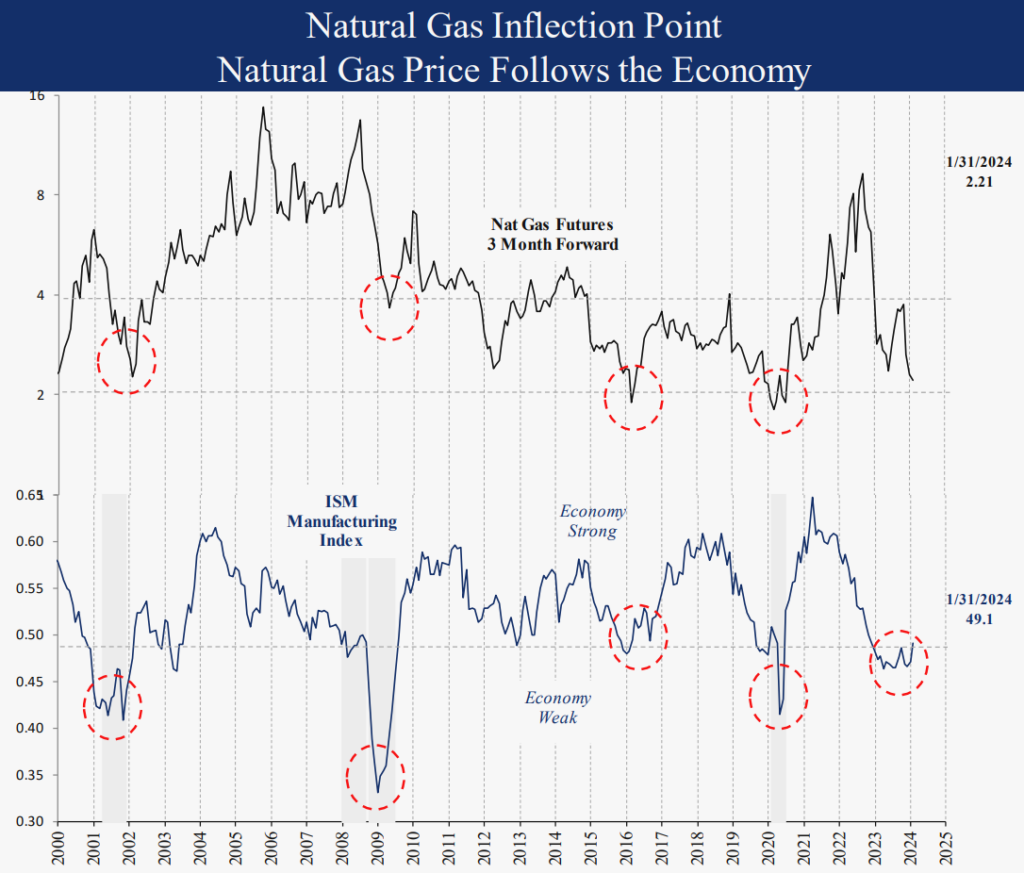
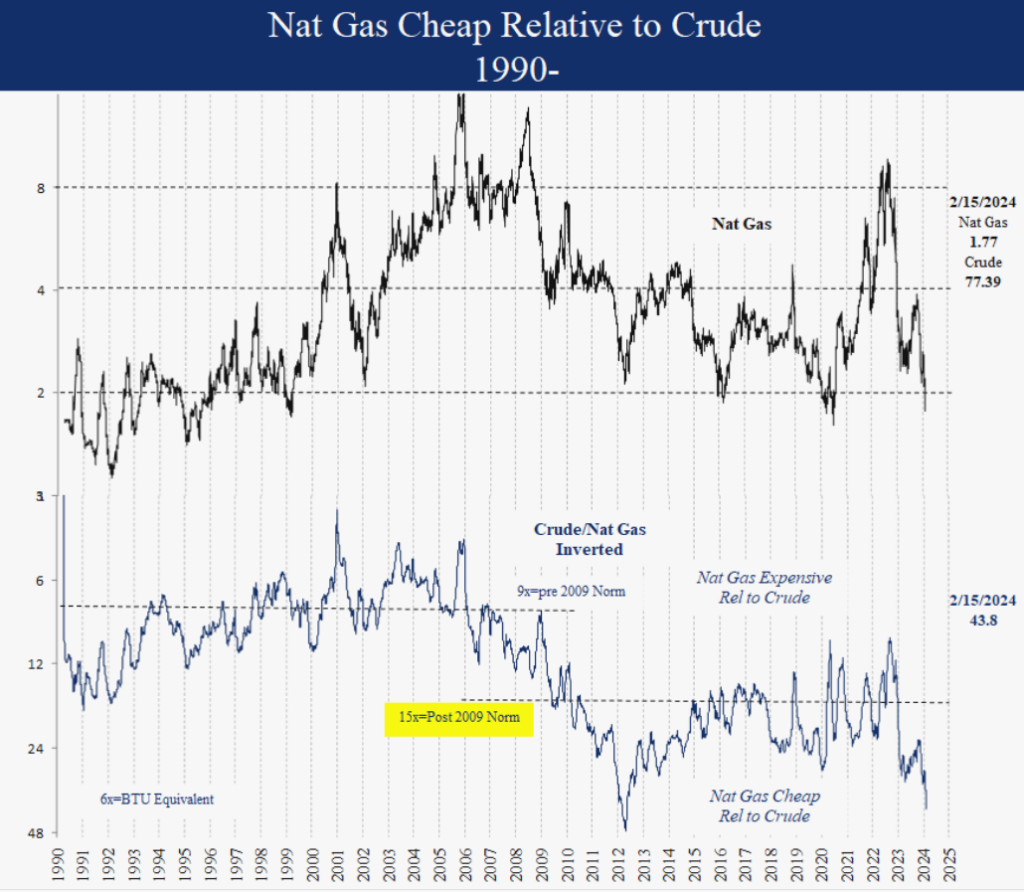
Natural Gas Down 80%: Inflection Point
Natural gas is down 80% from the $9 August 2022 peak to a recent $1.56 on 2/16/24. The extreme decline reflects a succession of bearish news items including record U.S. well production, the slowing economy, the warmest winter since 2015, and strong rains out west boosting hydro power generation. While we have found weather beyond 10 days to be unpredictable, economic activity is predictive for natural gas prices since it boosts demand. For instance, since 1990, when the ISM Index was weak as it is now, below 50, natural gas futures returned -28% annualized. Compare that to a 14.9% return for natural gas when the ISM was strong above 57 (20% of the time). The ISM is already up 3 points to 49.1 from the recent low of 46.0 in June. Further economic improvement, reported production shutdowns due to the price decline, and finally steady electricity demand increases from data center growth may mark $2 as a turning point for natural gas prices. Soon investors will be seeing upside from electricity demand spiking during summer heat waves. The primary risk is unabated production, with supply overwhelming demand in the short term.
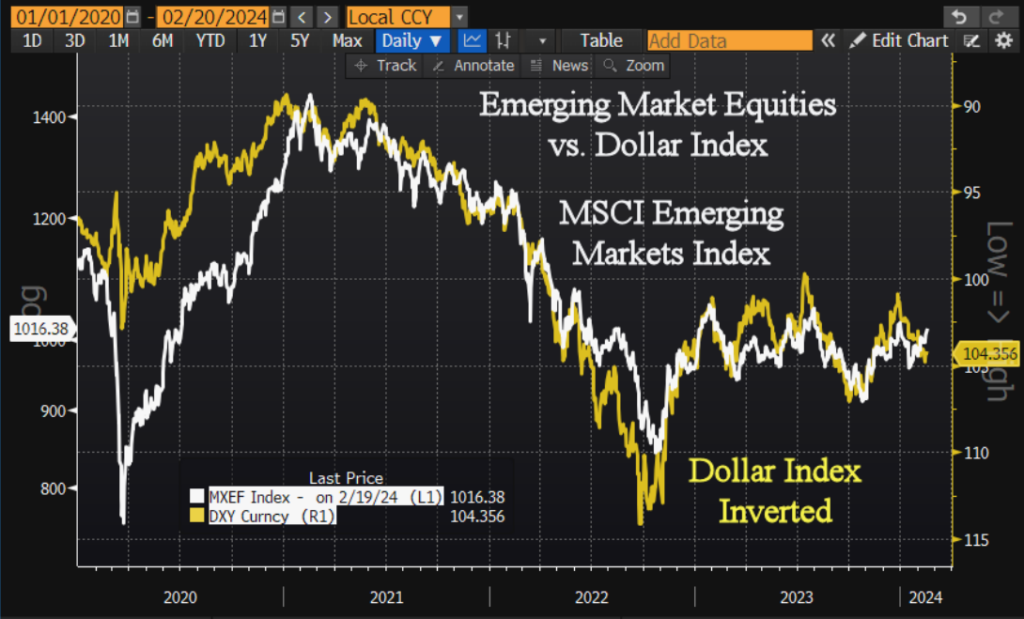
Dollar Index Up 4%: Risk for Emerging Markets
Since January, the Dollar Index is up 4%, putting pressure on commodities like copper and emerging markets equities. Since peaking at 114 in September 2022, the Dollar Index declined to 100 in 2023 but has since remained in a trading range including a recent rally to 104.3 as the U.S. 10-year Treasury yield moved higher. A further dollar rally is a risk for emerging markets, we are watching closely. For now, the positives for emerging markets dominate including extreme investor positioning after the Hang Seng Index collapse combined with China’s central bank (the PBoC) responding rapidly with expanding stimulus and rate cuts. Central bank stimulus is proven as one of the most reliable leading economic indicators for any country over time. In prior China cases, China equities reversed higher and the dollar weakened.
Summary
This month we discussed how the lower CPI inflation trend is an important indicator for the health and longevity of this economic cycle. Current mid-cycle conditions are quite positive for equities, commodities and higher Treasury bond yields with the economic outlook improving and inflation still declining. Once the economy accelerates, late cycle signposts include excessive optimism from investors, CEO’s and bank loan officers. That will be the time to cut back on equities for recession and bear market risk. We will continue to watch our indicators on a daily basis and shift exposure targets as needed. Thank you for your support and please contact us with any questions.
IMPORTANT DISCLOSURES
This review and outlook report (this “Report”) is for informational, illustration and discussion purposes only and is not intended to be, nor should it be construed as, financial, legal, tax or investment advice, of Brenton Point Wealth Advisors LLC or any of its affiliates (“Brenton Point”). This Report does not take into account the investment objectives, financial situation, restrictions, particular needs or financial, legal or tax situation of any particular person and should not be viewed as addressing any recipient’s particular investment needs. Recipients should consider the information contained in this Report as only a single factor in making an investment decision and should not rely solely on investment recommendations contained herein, if any, as a substitution for the exercise of independent judgment of the merits and risks of investments.
This material is based upon information obtained from various sources that Brenton Point believes to be reliable, but Brenton Point makes no representation or warranty with respect to the accuracy or completeness of such information. Views expressed herein are current only as of the date indicated and are subject to change without notice.
This Report contains certain forward looking statements opinions, estimates, projections, assessments and other views (collectively “Statements”). These Statements are subject to a number of assumptions, risks and uncertainties which may cause actual results, performance or achievements to be materially different from future results, performance or achievements expressed or implied by these forward looking statements and projections. Brenton Point makes no representations as to the reasonableness of such assumptions or the likelihood that such assumptions will coincide with actual events and this information should not be relied upon for that purpose. Changes in such assumptions could produce materially different results. Past performance is not a guarantee or indication of future results, and no representation or warranty, express or implied, is made regarding future performance of any financial instrument mentioned in this Report.
Any benchmark shown herein is shown for illustrative purposes only. No index benchmark is available for direct investment. It may not be possible to replicate the returns of any index, as the index may not include any trading commissions and costs or fees, may assume the reinvestment of income, and may have investment objectives, use trading strategies, or have other materials characteristics, such as credit exposure or volatility, that do not make it suitable for a particular person. This is not an offer or solicitation for the purchase or sale of any security, investment, or other product and should not be construed as such. References to specific financial instruments and to certain indices are for illustrative purposes only and provided for the purpose of making general market data available as a point of reference only; they are not intended to be, and should not be interpreted as recommendations to purchase or sell such securities. Investing in securities and other financial products entails certain risks, including the possible loss of the entire principal amount invested, as the value of investment can go down as well as up. You should obtain advice from your tax, financial, legal, and other advisors and only make investment decisions on the basis of your own objectives, experience, and resources.
Brenton Point accepts no liability for any loss (whether direct, indirect or consequential) occasioned to any person acting or refraining from action as a result of any material contained in or derived from this Report, except to the extent (but only to the extent) that such liability may not be waived, modified or limited under applicable law.
This Report may provide addresses of, or contain hyperlinks to, Internet websites. Brenton Point has not reviewed the linked Internet website of any third party and takes no responsibility for the contents thereof. Each such address or hyperlink is provided solely for your convenience and information, and the content of linked third party websites is not in any way incorporated herein. Recipients who choose to access such third-party websites or follow such hyperlinks do so at their own risk.
All marks referenced herein are the property of their respective owners. This Report is licensed for non-commercial use only, and may not be reproduced, distributed, forwarded, posted, published, transmitted, uploaded or otherwise made available to others for commercial purposes, including to individuals within an institution, without written authorization from Brenton Point.
Source of data and performance statistics: Bloomberg L.P. and Factset Research Systems Inc.
©Brenton Point Wealth Advisors LLC 2024

Michael Schaus
Director of Market Research
Michael Schaus is the Director of Market Research for Brenton Point Wealth Advisors and Zweig-DiMenna. Since joining Zweig-DiMenna in 1992, his focus has been on macroeconomic research, the analysis of…
READ MORE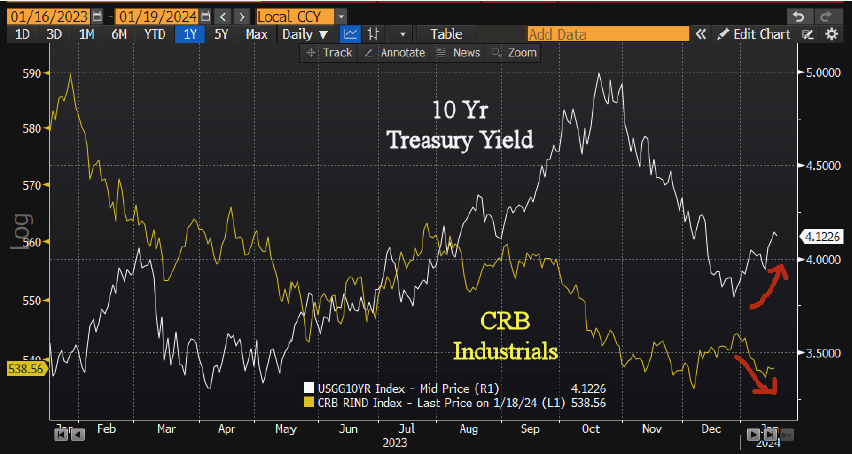
Sign up!
Sign up for our monthly newsletter and get the lastest news and research from our esteemed advisors here at Brenton point. Right into your inbox!