 Client Login

Diversification
Given the dramatic news and market volatility, we wanted to review our latest research again this week.
The social distancing and isolation required to stop the corona virus is effectively freezing the world economy like we have never seen, and a recession is almost certain. The hourly news headlines are upsetting and certainly have added to the panic. The risk of debt defaults by leveraged companies worsens the already negative economic outlook, with some talking about a depression. However, there are significant positives being overlooked. The actions by companies and individuals will stop the virus spread, causing the “epicurve” of virus cases to roll over. The forward looking view will reverse at that point, with markets focused on the recovery. Secondly, the 6-10% of GDP government fiscal response will help to bridge the gap to a recovery. The Federal Reserve response has been massive, signaling they will do whatever it takes to keep markets functioning and increase the money supply. This was the fastest rate move to zero in history. A similar rate move was effective in 2008 and 1932 as unemployment moved higher. It was the start of QE 1 in March 2009 that marked the bottom of the 2008 bear market. Finally, the near record volatility is the best indication of the extreme fear, and in prior cases this stage was closer to the low than the high. In prior comparable cases in the first big move off the low, stocks made back over half the crash decline. For these reasons, despite the extreme volatility and negative news, we are maintaining our neutral 3 rating for U.S. stocks, developed stocks and emerging markets. We are also maintaining our negative 2 rating in fixed income and favor higher quality credit and lower duration.
Diversification
Diversification among asset classes is a traditional means to reduce and spread risk in a portfolio. During times of financial stress, investments with low correlation can become correlated, compounding losses and increase risk. Correlation is the measure of how different investments move—high correlation means when one goes up, the other does as well, while low correlation means they generally move in opposite directions. Over the past few weeks, with investor placing a premium on liquidity, volatility spiked driving an increase in correlations. Therefore bond allocations have also experienced higher volatility as credit tightens and selling further pressures spreads. Even gold declined as the dollar rallied sharply. It is another sign of the extreme, and unsustainable, level of panic by investors. Maintaining a diversified portfolio remains critical in managing risk as there will be reversion to the mean.
Chart 1: Correlation: S&P 500 vs. Barclays Aggregate Bond Index

Market Volatility
In the last 10 days, the S&P 500 has moved up or down by an average of 6.2% each day, more than 20x the norm of 0.3%. For comparison it moved 3% during the European Debt crisis in 2011 and 5% during the Global Financial Crisis in 2008. Prior to that it briefly reached 6% in the 1987 crash and before that was in 1937 crash. Volatility occurs in periods of extreme fear, when market liquidity is extremely low. In other words, when there are few people willing to put their capital at risk in the market, even small orders will move the price since there are very few people willing to take the other side. In prior comparable cases, the market rallied back over half the crash decline in the first big move off the low. It is after this initial rally when volatility subsides that downside risk will be higher.
Chart 2: S&P Volatility: 6.2% Daily Moves: 1928-1920

The Economy
With the world at a standstill, economist estimates for Q2 GDP are sharply negative in some cases. While there have been few official economic reports out yet, a recession seems all but certain. The issues begin with layoffs and a likely sharply higher unemployment rate. The pressure in the bond market is another issue. The High Yield Spread at 10.1% is the highest since 2008. It means that highly leveraged companies will not have access to funding for operations, putting them at risk of default. It can create a negative feedback loop, since defaults can mean business failures, more job losses, and lost income.
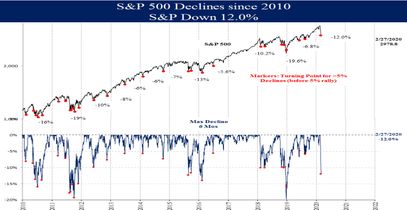
We don’t know how negative Q2 GDP will be, so we looked at the worst quarters since 1950. These include 2008 as you would expect, 1982, 1980 and 1958. We know the stock market declined over 50% in the 2008 case, and that size decline might be the consensus on Wall Street. However, the S&P 500 decline was less than 30% in all three prior cases. In other words, the 30% stock market decline behind us may have already discounted the economic weakness likely ahead.
Chart 3: Leveraged Companies at Risk of Default

Crude Oil Down 65%
Crude oil fell 65% in the last 3 months to $21 a barrel, the lowest since 2002. In the 1986 and 1990 cases, large oil declines were positive for stocks and the U.S. economy, since the U.S. was a net importer of oil. You can see that more recently declines were correlated with stocks and the economy. A sharply weakening global economy, the rise of electric cars, a price war between OPEC and Russia, and finally a strong dollar combined to cause the biggest decline since 2008.
Chart 4: Crude Oil Declines vs. S&P 500

In summary, we are maintaining our neutral 3 rating for U.S. stocks, developed stocks and emerging markets. We are also maintaining our 2 rating in fixed income and favor higher quality credit and lower duration.
IMPORTANT DISCLOSURES
This review (this “Report”) is for informational, illustration and discussion purposes only and is not intended to be, nor should it be construed as, financial, legal, tax or investment advice, of Brenton Point Wealth Advisors LLC or any of its affiliates (“Brenton Point”). This Report does not take into account the investment objectives, financial situation, restrictions, particular needs or financial, legal or tax situation of any particular person and should not be viewed as addressing any recipient’s particular investment needs. Recipients should consider the information contained in this Report as only a single factor in making an investment decision and should not rely solely on investment recommendations contained herein, if any, as a substitution for the exercise of independent judgment of the merits and risks of investments.
This material is based upon information obtained from various sources that Brenton Point believes to be reliable, but Brenton Point makes no representation or warranty with respect to the accuracy or completeness of such information. Views expressed herein are current only as of the date indicated and are subject to change without notice.
This Report contains certain forward looking statements opinions, estimates, projections, assessments and other views (collectively “Statements”). These Statements are subject to a number of assumptions, risks and uncertainties which may cause actual results, performance or achievements to be materially different from future results, performance or achievements expressed or implied by these forward looking statements and projections. Brenton Point makes no representations as to the reasonableness of such assumptions or the likelihood that such assumptions will coincide with actual events and this information should not be relied upon for that purpose. Changes in such assumptions could produce materially different results. Past performance is not a guarantee or indication of future results, and no representation or warranty, express or implied, is made regarding future performance of any financial instrument mentioned in this Report.
Any benchmark shown herein is shown for illustrative purposes only. No index benchmark is available for direct investment. It may not be possible to replicate the returns of any index, as the index may not include any trading commissions and costs or fees, may assume the reinvestment of income, and may have investment objectives, use trading strategies, or have other materials characteristics, such as credit exposure or volatility, that do not make it suitable for a particular person. This is not an offer or solicitation for the purchase or sale of any security, investment, or other product and should not be construed as such. References to specific financial instruments and to certain indices are for illustrative purposes only and provided for the purpose of making general market data available as a point of reference only; they are not intended to be, and should not be interpreted as recommendations to purchase or sell such securities. Investing in securities and other financial products entails certain risks, including the possible loss of the entire principal amount invested, as the value of investment can go down as well as up. You should obtain advice from your tax, financial, legal, and other advisors and only make investment decisions on the basis of your own objectives, experience, and resources.
Brenton Point accepts no liability for any loss (whether direct, indirect or consequential) occasioned to any person acting or refraining from action as a result of any material contained in or derived from this Report, except to the extent (but only to the extent) that such liability may not be waived, modified or limited under applicable law.
This Report may provide addresses of, or contain hyperlinks to, Internet websites. Brenton Point has not reviewed the linked Internet website of any third party and takes no responsibility for the contents thereof. Each such address or hyperlink is provided solely for your convenience and information, and the content of linked third party websites is not in any way incorporated herein. Recipients who choose to access such third-party websites or follow such hyperlinks do so at their own risk.
All marks referenced herein are the property of their respective owners. This Report is licensed for non-commercial use only, and may not be reproduced, distributed, forwarded, posted, published, transmitted, uploaded or otherwise made available to others for commercial purposes, including to individuals within an institution, without written authorization from Brenton Point.
Source of data and performance statistics: Bloomberg L.P. and Factset Research Systems Inc.
©Brenton Point Wealth Advisors LLC 2020

Michael Schaus
Director of Market Research
Michael Schaus is the Director of Market Research for Brenton Point Wealth Advisors and Zweig-DiMenna. Since joining Zweig-DiMenna in 1992, his focus has been on macroeconomic research, the analysis of…
READ MORE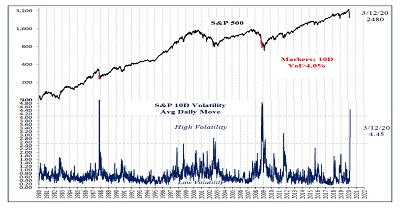
Sign up!
Sign up for our monthly newsletter and get the lastest news and research from our esteemed advisors here at Brenton point. Right into your inbox!