 Client Login

Fear and Interest Rate Volatility
Investing Environment Review and Outlook – Volume 69
Fear and Interest Rate Volatility
Last month we discussed the strong economic outlook indicators. The market volatility following the bank failures this week caused many of those indicators to reverse back to neutral. This type of change is a great example of why we rely on known conditions to set investment allocations rather than predictions. The facts can, and often do change quickly. This month we discuss the implications of some of those changes behind the dramatic headlines, including interest rate volatility, the return of extreme investor positioning, and of course, inflation.
Long-term bonds upticked to a neutral 3 rating. U.S., foreign-developed, and emerging markets equities remain bullish 5 ratings. Gold remains a bullish 5 rating and industrial commodities downticked to a neutral 3 rating.
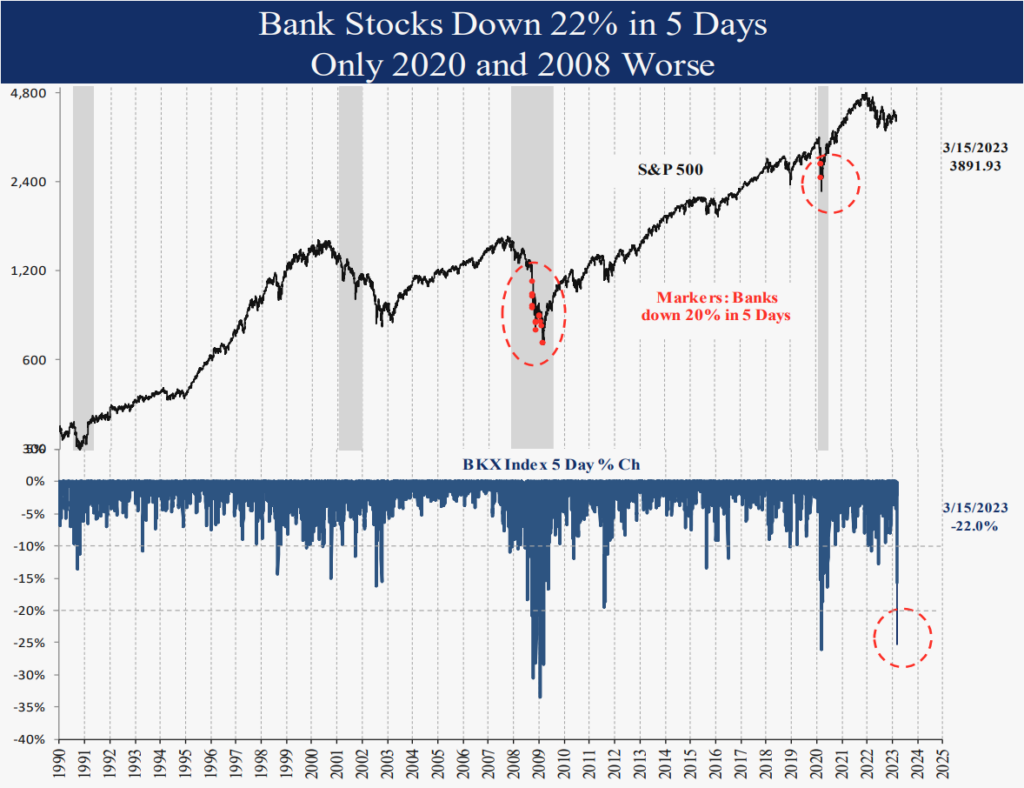
Bank Stocks Volatility Extreme
Bank stocks declined 29% from their February peak to 3/15, including a near record 22% decline in 5 days. The only bigger 5 day declines since 1990 were in 2008 and 2020.
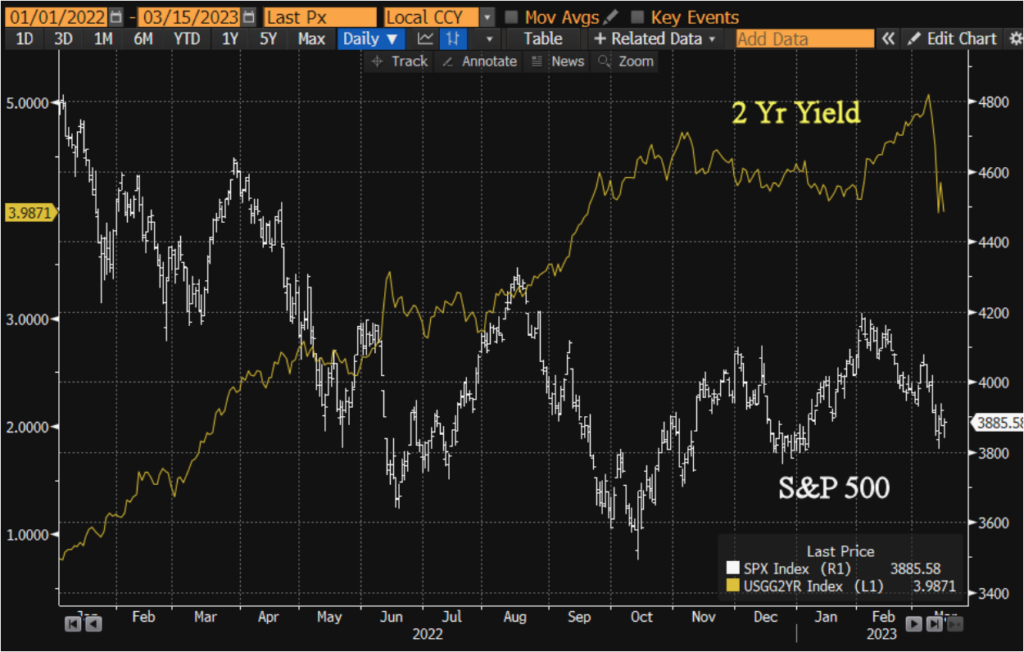
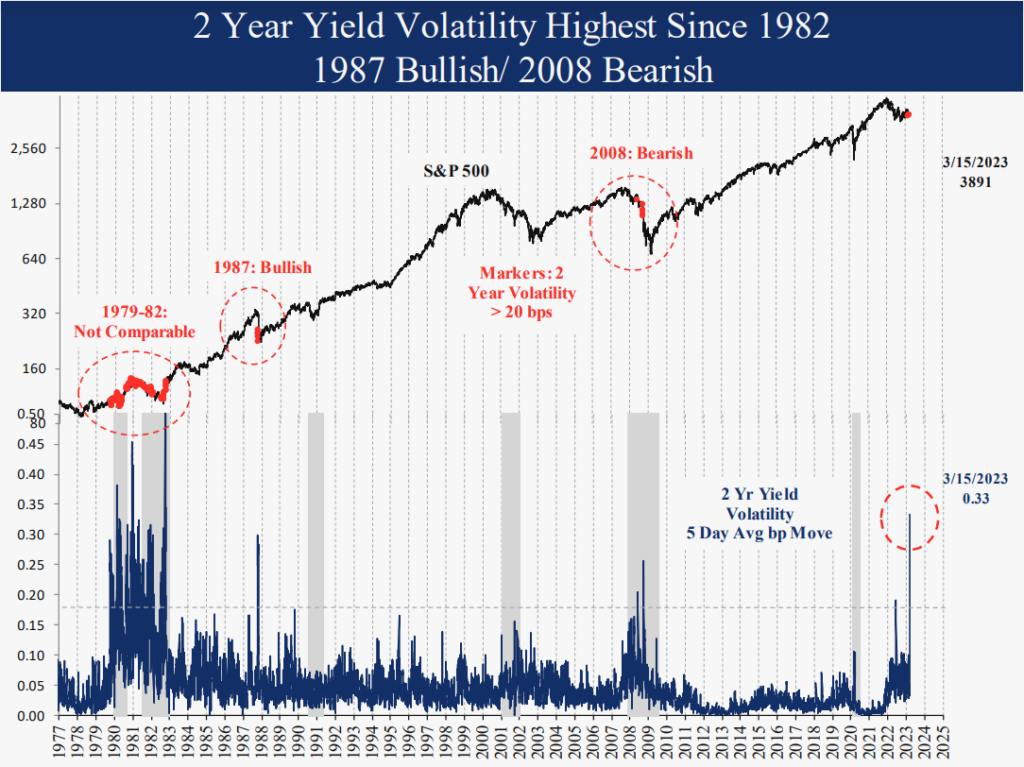
2 Year Yield Volatility
The 2-year Treasury yield fell from 5% to 4% in just 3 days last week following the Silicon Valley Bank failure on 3/10. The fear of contagion and systemic risks caused Fed rate hike expectations to fall from three to just one, and the 2-year yield trend lower. To put this 2-year rate move in perspective, the average daily move in the last 5 days was 33 bps, the highest since 1982, 41 years ago. Even in 2008 during the global financial crisis, the peak 5-day volatility was just 25 bps. Most investors assume it is a bearish indication for equities as it was in 2008. However, this kind of volatility was bullish in the 1987 case coming after the October crash. The move indicated the Fed would provide any liquidity necessary. Today’s Bank Term Lending Program is similar, assuring investors deposits are secure. 2008 was different in that borrowers were at risk, rather than the banks themselves. In bank jargon, it is a liability (bank security holdings) issue, not an asset (loan) issue. Whether contagion spreads is unknowable at this point, but junk-yield spreads are not showing recession risk for now, an indication this crisis can be contained.
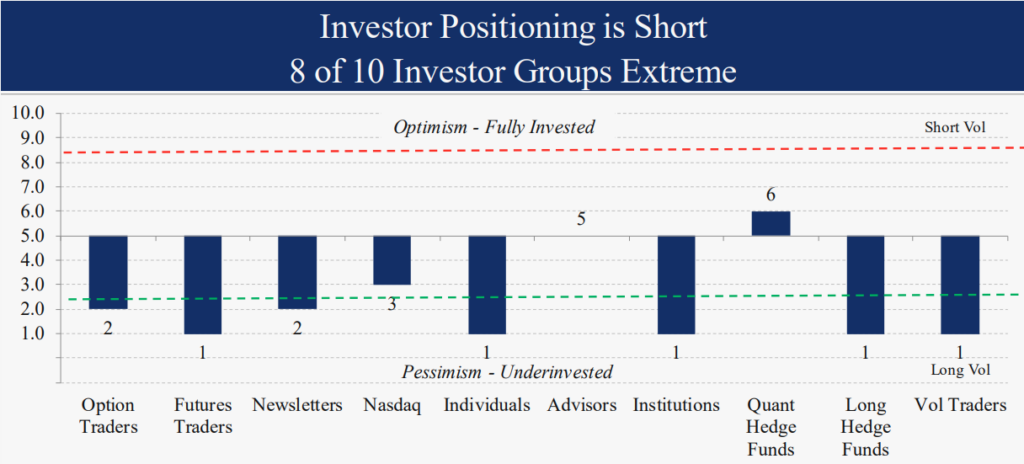
Investor Positioning Extreme: Bullish
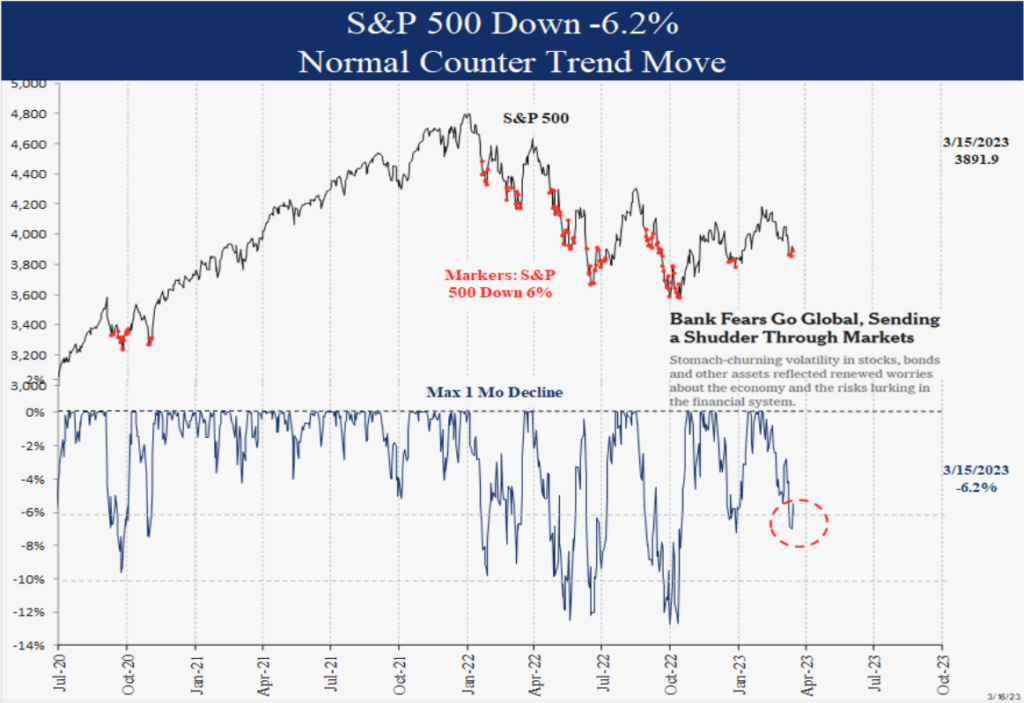
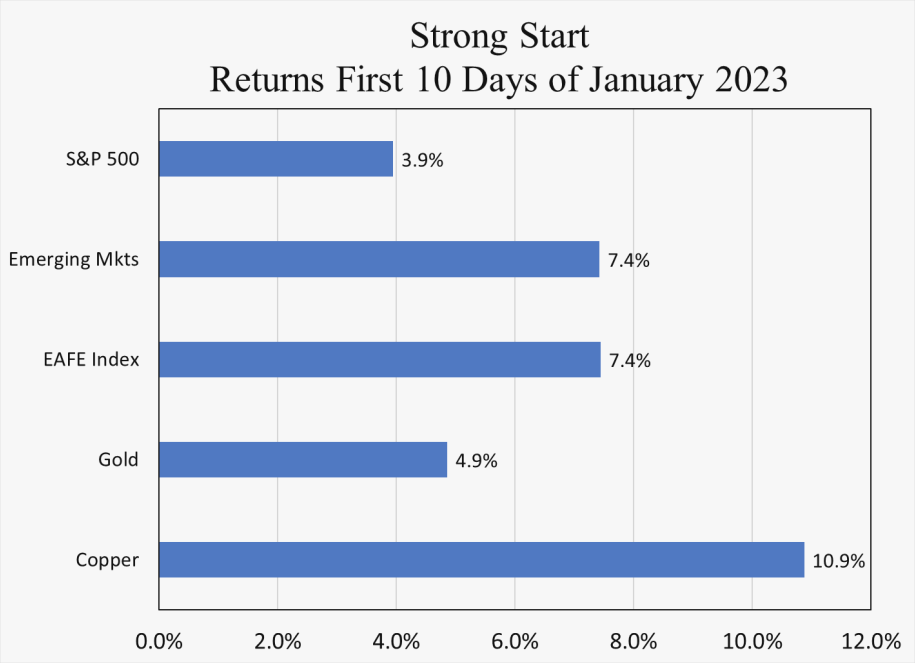
After a week of dramatic headlines, investor positioning has again reached extreme levels like we saw in December. Historically, when most investor groups cut back their exposure, equities have less downside risk and more upside potential, since investors have more cash on the sidelines to drive stocks higher. Extreme positioning is more significant when other economic indicators line up as well like we have today. After extreme positioning in December, equities rallied 6.2% in January. The current 6% decline in the S&P is a normal counter trend move, despite the headlines to the contrary. Obviously, bank stocks were more extreme.
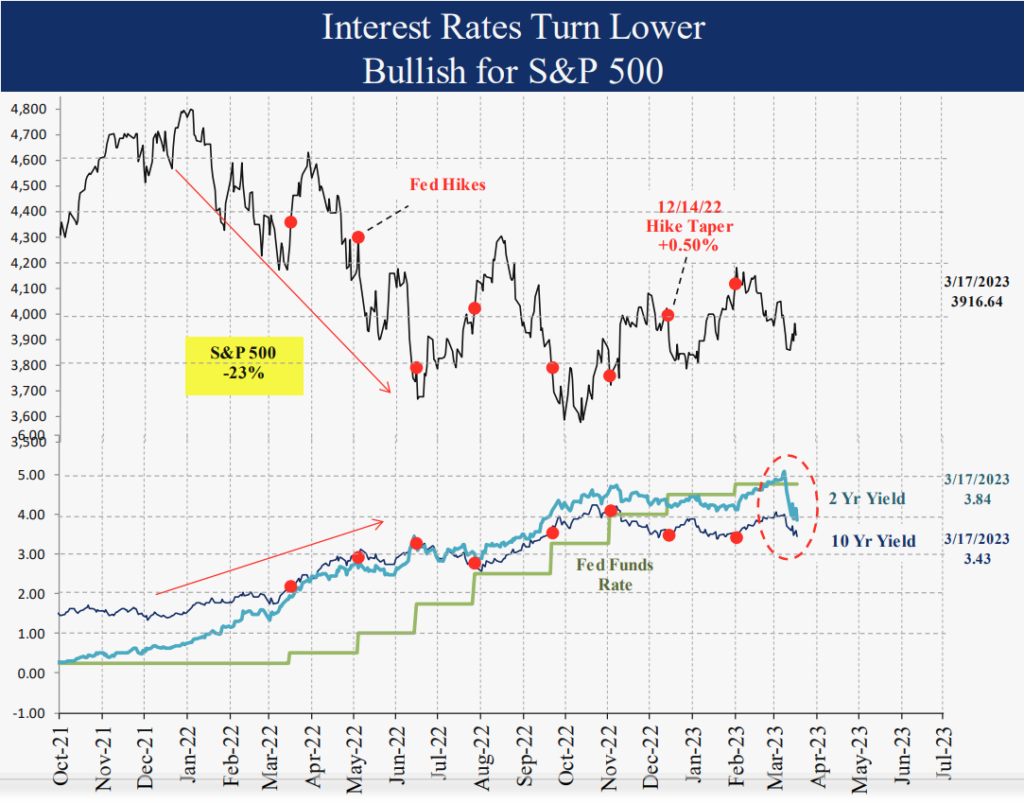
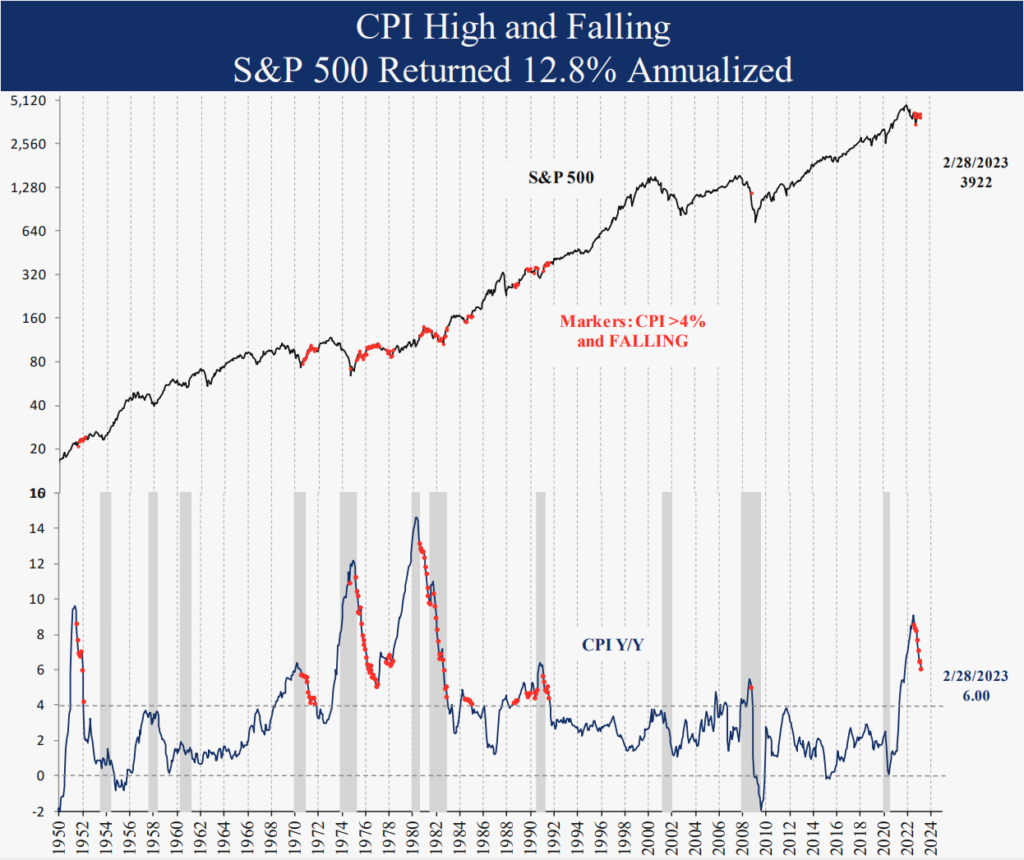
Inflation is Falling: Bullish
Headline February inflation was 6.0% Y/Y, down from the 9.1% June peak and falling faster than prior inflation spikes. Falling inflation while the Fed was hiking rates was bullish historically for the S&P 500 with a 15% annualized return, above the norm. Also consider that leading inflation indicators are pointing lower. Our inflation outlook model was 40.3 in February and crude oil is already down 10% in March. Finally, the prior year comps averaged 0.9% M/M for the next 4 months, which means any M/M number this year below that will translate into a lower Y/Y number. For instance, if CPI averages 0.4% over the next 4 months, CPI Y/Y will be just 4.0% by June. How low inflation will go is unknowable, but we can say the inflation spike is over, and bullish.
Summary
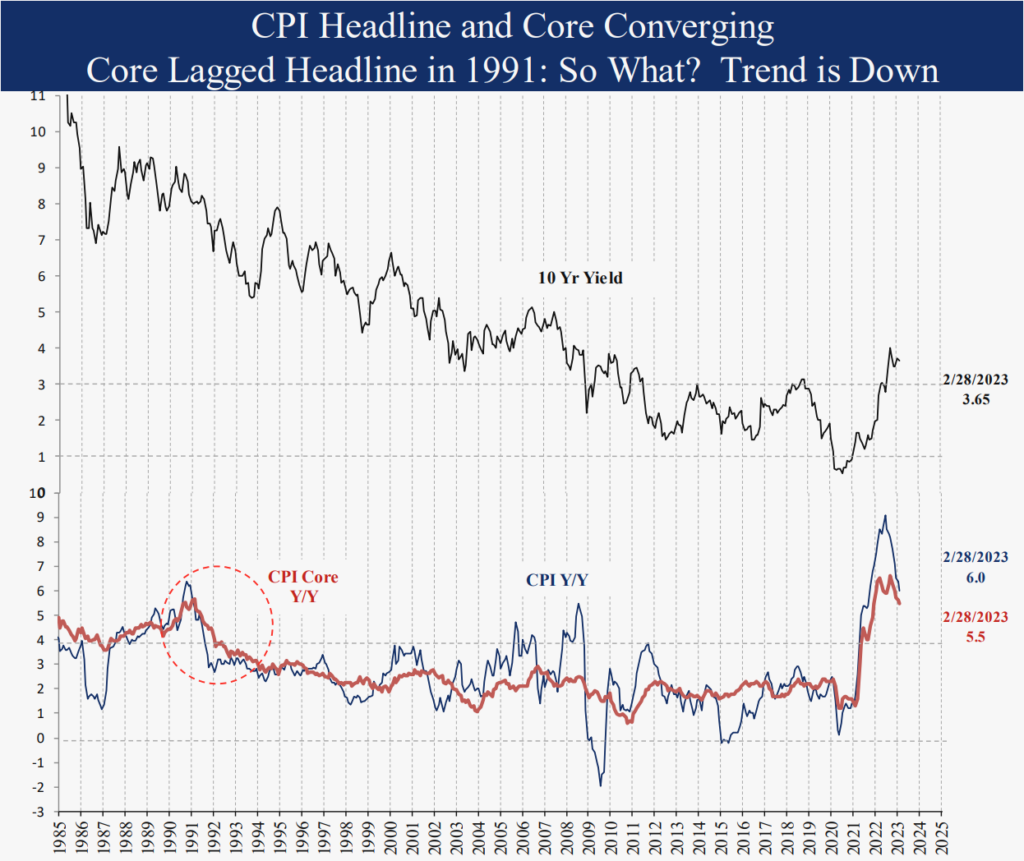
This month we discussed the interest rate volatility, extreme investor positioning, and the declining inflation rate. The bank failures certainly hit confidence and may have delayed the economic rebound, but equity indicators improved even further with more cash on the sidelines and lower inflation more likely. Declining inflation and a falling 10-year yield are bullish for equities, even when the Fed is hiking rates. Further contagion remains an unknowable risk, but given current conditions today, equities are likely to move higher. We cut the commodity rating due to the reversal in the economic outlook model back to neutral combined with the recent strength in the dollar. We moved long-term bonds to neutral also due to the more neutral economic outlook, but we expect that to reverse higher. We will continue to watch our indicators on a daily basis for changes. Thank you for your support and please contact us with any questions.
IMPORTANT DISCLOSURES
This review and outlook report (this “Report”) is for informational, illustration and discussion purposes only and is not intended to be, nor should it be construed as, financial, legal, tax or investment advice, of Brenton Point Wealth Advisors LLC or any of its affiliates (“Brenton Point”). This Report does not take into account the investment objectives, financial situation, restrictions, particular needs or financial, legal or tax situation of any particular person and should not be viewed as addressing any recipient’s particular investment needs. Recipients should consider the information contained in this Report as only a single factor in making an investment decision and should not rely solely on investment recommendations contained herein, if any, as a substitution for the exercise of independent judgment of the merits and risks of investments.
This material is based upon information obtained from various sources that Brenton Point believes to be reliable, but Brenton Point makes no representation or warranty with respect to the accuracy or completeness of such information. Views expressed herein are current only as of the date indicated and are subject to change without notice.
This Report contains certain forward looking statements opinions, estimates, projections, assessments and other views (collectively “Statements”). These Statements are subject to a number of assumptions, risks and uncertainties which may cause actual results, performance or achievements to be materially different from future results, performance or achievements expressed or implied by these forward looking statements and projections. Brenton Point makes no representations as to the reasonableness of such assumptions or the likelihood that such assumptions will coincide with actual events and this information should not be relied upon for that purpose. Changes in such assumptions could produce materially different results. Past performance is not a guarantee or indication of future results, and no representation or warranty, express or implied, is made regarding future performance of any financial instrument mentioned in this Report.
Any benchmark shown herein is shown for illustrative purposes only. No index benchmark is available for direct investment. It may not be possible to replicate the returns of any index, as the index may not include any trading commissions and costs or fees, may assume the reinvestment of income, and may have investment objectives, use trading strategies, or have other materials characteristics, such as credit exposure or volatility, that do not make it suitable for a particular person. This is not an offer or solicitation for the purchase or sale of any security, investment, or other product and should not be construed as such. References to specific financial instruments and to certain indices are for illustrative purposes only and provided for the purpose of making general market data available as a point of reference only; they are not intended to be, and should not be interpreted as recommendations to purchase or sell such securities. Investing in securities and other financial products entails certain risks, including the possible loss of the entire principal amount invested, as the value of investment can go down as well as up. You should obtain advice from your tax, financial, legal, and other advisors and only make investment decisions on the basis of your own objectives, experience, and resources.
Brenton Point accepts no liability for any loss (whether direct, indirect or consequential) occasioned to any person acting or refraining from action as a result of any material contained in or derived from this Report, except to the extent (but only to the extent) that such liability may not be waived, modified or limited under applicable law.
This Report may provide addresses of, or contain hyperlinks to, Internet websites. Brenton Point has not reviewed the linked Internet website of any third party and takes no responsibility for the contents thereof. Each such address or hyperlink is provided solely for your convenience and information, and the content of linked third party websites is not in any way incorporated herein. Recipients who choose to access such third-party websites or follow such hyperlinks do so at their own risk.
All marks referenced herein are the property of their respective owners. This Report is licensed for non-commercial use only, and may not be reproduced, distributed, forwarded, posted, published, transmitted, uploaded or otherwise made available to others for commercial purposes, including to individuals within an institution, without written authorization from Brenton Point.
Source of data and performance statistics: Bloomberg L.P. and Factset Research Systems Inc.
©Brenton Point Wealth Advisors LLC 2023

Michael Schaus
Director of Market Research
Michael Schaus is the Director of Market Research for Brenton Point Wealth Advisors and Zweig-DiMenna. Since joining Zweig-DiMenna in 1992, his focus has been on macroeconomic research, the analysis of…
READ MORE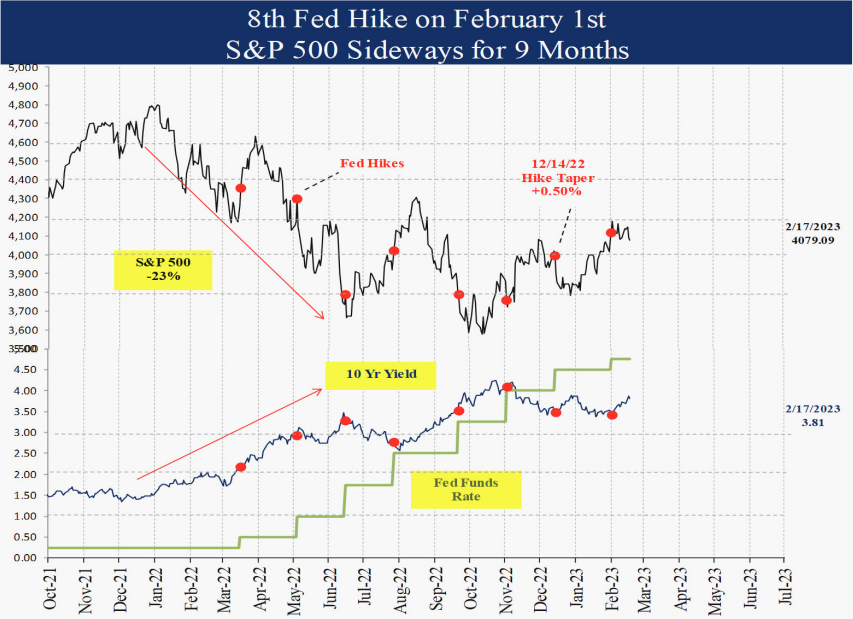
Sign up!
Sign up for our monthly newsletter and get the lastest news and research from our esteemed advisors here at Brenton point. Right into your inbox!