 Client Login

Investing Environment Review and Outlook
The resurgence of COVID-19 cases to new records should be no surprise given the lack of social distancing and masks in many states. A weekly ISI investor survey ranks the tragic pandemic as the number one risk for markets. While we leave predictions of the pandemic outcome to the experts, we are focused on the implications for investment assets. Despite the one of a kind COVID-19 pandemic recession, surprisingly the recovery is following prior cycles, with bullish implications for equities, both foreign and domestic, along with commodities. This month we affirm our bullish 5 ranking for equities, industrial commodities and gold. Our long-term bond ranking remains a cautious 1 based on the risk of higher long-term interest rates and lower long-term bond prices.
Goldilocks: Bullish for Equities
The most bullish stage of the economic cycle for equities is emerging from a recession when economic growth is positive, rates and inflation are low and the Fed is easing, conditions we have today. For instance, since 1950 the S&P 500 returned 24% annualized (over 2x the norm) when the Economic Outlook indicators were this strong and the Fed was loose. Returns were consistent in all periods and max declines were just 6-10%. This is the best, lowest risk stage of the cycle for stocks, and negative press stories are the norm. In addition to strong S&P 500 returns, developed foreign equities returned 18.4% (3x norm) since 1980 and Emerging Markets returned 37% (5x norm) since 1987. This partly explains the seeming contradiction between higher COVID-19 cases and higher stock prices.
Chart 1:Goldilocks Bullish For Equities: Moderate Growth + Loose Fed

Economy Accelerating Despite Pandemic: Recession Likely Over
On July 1st,the ISM manufacturing report beat expectations at 52.6 for June up from 43.9 in May. The ISM Index has been the most reliable economic indicator, with timely data and very few revisions dating back to 1948. June was the highest reading since April 2019, confirming the economy is accelerating, in line with our economic indicators, despite the COVID-19 pandemic. In all the prior recession cases it marked the end of that recession. This makes it likely the 2020 recession is now over.
Chart 2: U.S. Economy Rebound: Marks End of Prior Recessions and Bullish for Equities

U.S. Economy Rebound: Bullish for Stocks

- The S&P 500 was higher 3 months later in all but two cases.
- Average return of 5.0%.
- The next 10% move in equities was up 86% of the time.
2nd Quarter S&P 500 up 20.5%: Bullish For Equities
The S&P 500 was up 20.5% in the second quarter, the strongest move since 1938. Of the 11 prior cases when the index was up over 10% for the quarter, the S&P 500 was up an average of 4% 3 months later and 11% 6 months later. The worst cases 6 months out were in 1948 and 1933, both down 6%. The next 5% and 10% moves were up 81% of the time, declining only in 1975 and 1948. The sharp rally this year has caused skepticism, but history shows tape this strong is generally followed by further gains.
12 Prior Cases of S&P 500 2nd Quarter Returns Up Over 10%

One Month Thrusts: 2020 Following the Pattern
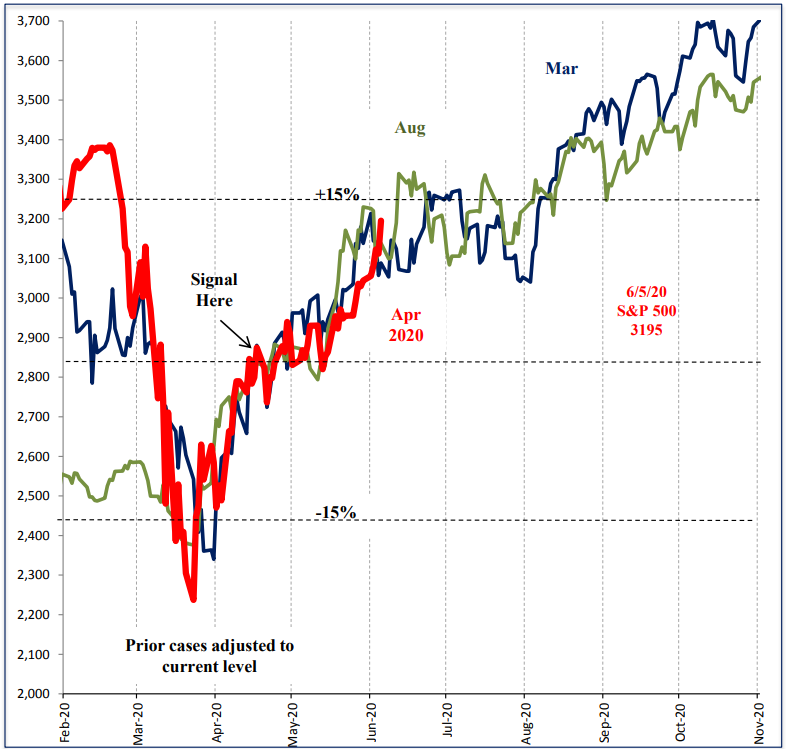
The S&P 500 continues to follow the pattern of the only two post-war one-month thrusts, in 2009 and 1982, when the S&P 500 rose 10% above the one-month average. In the prior cases at this point there was a consolidation phase with 6-8% declines for 2 months that preceded the next 15 – 20% leg higher.
Chart 3: One-Month Thrusts: 2 Prior Post War Cases: Sep 1982/Mar 2009

Savings Deposits Up $1.4 trillion: Positive For The Economy and Stocks
One positive from the pandemic has been a record jump in savings deposits, as spending declined while fiscal stimulus and unemployment insurance helped to maintain aggregate income levels, despite the high unemployment rate. Since March 1st, savings deposits are up $1.4 trillion, equal to 6.5% of GDP. In the last two cycles, a rise in savings deposits was long term fuel for upside in both the stock market and the economy for more than 3 years.
Chart 4: Savings Deposits Up 20% Y/Y

Stock Sector Returns: Possible Rotation
The strong economic outlook combined with a loose Fed only occurs 20% of the time on average. Historically this is the best combination for stocks since the economy is accelerating while the Fed has not yet tightened. We tested equity sectors back to 1990 and found Materials, Financials and Energy generated the best returns with these conditions, all over 2x their norm. Technology, Utilities and Healthcare were the weakest between 0.8 to 1.1x their norm. Since the March 23rd low, energy, consumer discretionary and materials have outperformed as you would expect but financials have lagged due partly to the flat yield curve. They could reverse sharply if long-term rates rise out of their recent tight trading range. Healthcare, utilities and staples were also weak as expected but technology has been the strong outlier due to the obvious increased use of all technology during the pandemic.
Chart 5: Equity Sector Returns during Goldilocks Periods since 1990:Return Relative to Norm.

“W” Recovery Risk
The resurgence in COVID-19 cases and news of states reclosing has raised the concern about a “W” recovery, where there is a rebound in growth followed by a second leg lower as virus cases climb. The Jefferies High Frequency Activity Index has flattened since mid June. It is assumed that if the economy turns lower, that stocks would decline sharply again. Since 1946 there were 4 cases of W recoveries. In the first three, 1949, 1961 and 1970, this assumption was not true. Stocks did not, in fact, turn lower during the second leg down in GDP. In the 1980-82 case, the second GDP decline in 1982 was actually a separate recession caused by aggressive Fed hiking to 20% to stop inflation, very different circumstances from today. Overall, the empirical evidence shows that a “W” recovery is not the risk for stocks that investors assume.
Chart 6: JefData U.S. Economic Activity Index:.

Chart 7: GDP “W” Recoveries: 1946 – 1986

Investor Positioning is Mixed
Investor positioning is mixed across different groups. Options and futures traders are the most bullish, although there are committed bears like individuals who have been persistently and unusually bearish throughout the rally since March. Institutions have also maintained their negative exposure despite the rally. When more groups turn positive at the same time, generally equity returns are lower depending on other conditions, but for now positioning is not significant either way.
Chart 8: Equity Investor Positioning is Mixed: 10 Groups

Summary
The 2020 recession is one of a kind, but the economic recovery is so far quite normal from an economic and investor behavior standpoint. The extreme signals in the stock market tape, the Fed, the economy and in consumer savings are rare and significantly bullish long term for stocks, giving us conviction in our positive ratings and optimistic view. As always, we will continue testing assumptions and monitoring our indicators closely for changes. It is important to expect 5-10% declines in stocks, as they are normal even when conditions are positive. Thank you for your support and please contact your advisor with any questions.
IMPORTANT DISCLOSURES
This review and outlook report (this “Report”) is for informational, illustration and discussion purposes only and is not intended to be, nor should it be construed as, financial, legal, tax or investment advice, of Brenton Point Wealth Advisors LLC or any of its affiliates (“Brenton Point”). This Report does not take into account the investment objectives, financial situation, restrictions, particular needs or financial, legal or tax situation of any particular person and should not be viewed as addressing any recipient’s particular investment needs. Recipients should consider the information contained in this Report as only a single factor in making an investment decision and should not rely solely on investment recommendations contained herein, if any, as a substitution for the exercise of independent judgment of the merits and risks of investments.
This material is based upon information obtained from various sources that Brenton Point believes to be reliable, but Brenton Point makes no representation or warranty with respect to the accuracy or completeness of such information. Views expressed herein are current only as of the date indicated and are subject to change without notice.
This Report contains certain forward looking statements opinions, estimates, projections, assessments and other views (collectively “Statements”). These Statements are subject to a number of assumptions, risks and uncertainties which may cause actual results, performance or achievements to be materially different from future results, performance or achievements expressed or implied by these forward looking statements and projections. Brenton Point makes no representations as to the reasonableness of such assumptions or the likelihood that such assumptions will coincide with actual events and this information should not be relied upon for that purpose. Changes in such assumptions could produce materially different results. Past performance is not a guarantee or indication of future results, and no representation or warranty, express or implied, is made regarding future performance of any financial instrument mentioned in this Report.
Any benchmark shown herein is shown for illustrative purposes only. No index benchmark is available for direct investment. It may not be possible to replicate the returns of any index, as the index may not include any trading commissions and costs or fees, may assume the reinvestment of income, and may have investment objectives, use trading strategies, or have other materials characteristics, such as credit exposure or volatility, that do not make it suitable for a particular person. This is not an offer or solicitation for the purchase or sale of any security, investment, or other product and should not be construed as such. References to specific financial instruments and to certain indices are for illustrative purposes only and provided for the purpose of making general market data available as a point of reference only; they are not intended to be, and should not be interpreted as recommendations to purchase or sell such securities. Investing in securities and other financial products entails certain risks, including the possible loss of the entire principal amount invested, as the value of investment can go down as well as up. You should obtain advice from your tax, financial, legal, and other advisors and only make investment decisions on the basis of your own objectives, experience, and resources.
Brenton Point accepts no liability for any loss (whether direct, indirect or consequential) occasioned to any person acting or refraining from action as a result of any material contained in or derived from this Report, except to the extent (but only to the extent) that such liability may not be waived, modified or limited under applicable law.
This Report may provide addresses of, or contain hyperlinks to, Internet websites. Brenton Point has not reviewed the linked Internet website of any third party and takes no responsibility for the contents thereof. Each such address or hyperlink is provided solely for your convenience and information, and the content of linked third party websites is not in any way incorporated herein. Recipients who choose to access such third-party websites or follow such hyperlinks do so at their own risk.
All marks referenced herein are the property of their respective owners. This Report is licensed for non-commercial use only, and may not be reproduced, distributed, forwarded, posted, published, transmitted, uploaded or otherwise made available to others for commercial purposes, including to individuals within an institution, without written authorization from Brenton Point.
Source of data and performance statistics: Bloomberg L.P. and Factset Research Systems Inc.
©Brenton Point Wealth Advisors LLC 2020

Michael Schaus
Director of Market Research
Michael Schaus is the Director of Market Research for Brenton Point Wealth Advisors and Zweig-DiMenna. Since joining Zweig-DiMenna in 1992, his focus has been on macroeconomic research, the analysis of…
READ MORE
Sign up!
Sign up for our monthly newsletter and get the lastest news and research from our esteemed advisors here at Brenton point. Right into your inbox!