 Client Login

Boom Phase of the Economic Cycle
Investing Environment Review and Outlook – Volume 46
Boom Phase of the Economic Cycle
The Boom Phase of the economic cycle arrived in February. While Goldilocks elements like low inflation and a loose Federal Reserve remain, the strong global economy, surging commodity prices, rising 10-year yield and extreme investor positioning are enough to place us in the fourth phase of the economic cycle. This month we discuss the implications for investors, particularly the jump in the 10-year Treasury yield. We also discuss the recent gold weakness and change in equity investor positioning. Despite the dramatic financial headlines and recent uptick in equity volatility, our core indicators remain bullish; namely the strong economic outlook, loose Federal Reserve and low inflation. Our U.S. Equity rating remains at a bullish 4. Foreign developed and emerging market equities remain at a bullish 5, along with gold and commodities. Long-term bonds remain a cautious 1.
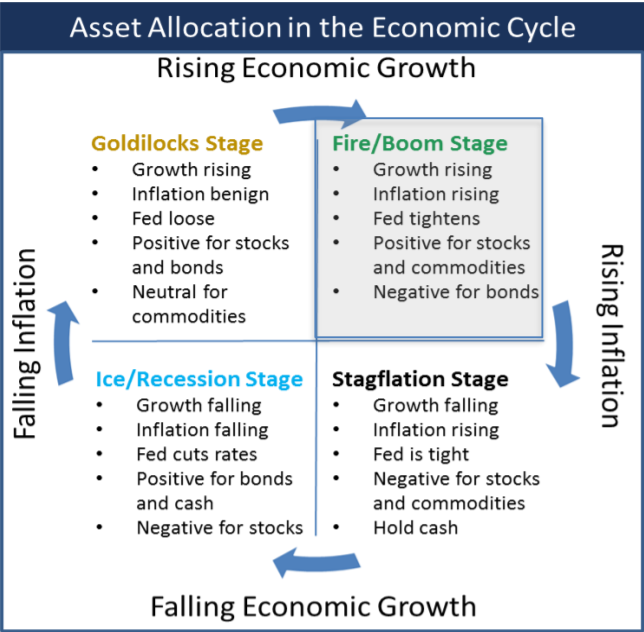
The Fire/Boom Stage
- Accelerating economic growth and rising inflation
- Fed Policy: Tight/raising rates to fight inflation
- Markets: Stocks rally initially. Industrial commodities rally and bonds decline (yields rise)
- Equity Investor Sentiment: Optimistic building to irrational exuberance
- Recommended Asset Allocation: Overweight stocks and commodities and underweight bonds and cash
- Examples: 2017, 1999, 1994, 1987
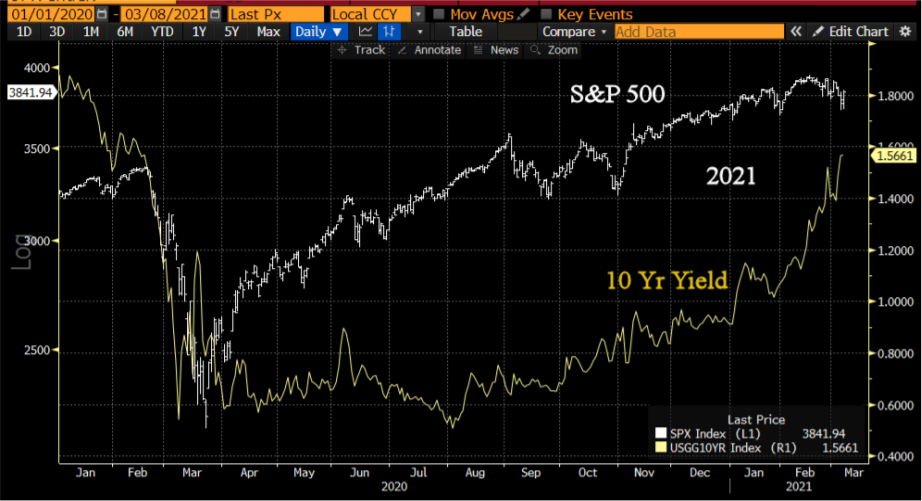
10-Year Bond Yields Up: Positive for Equities
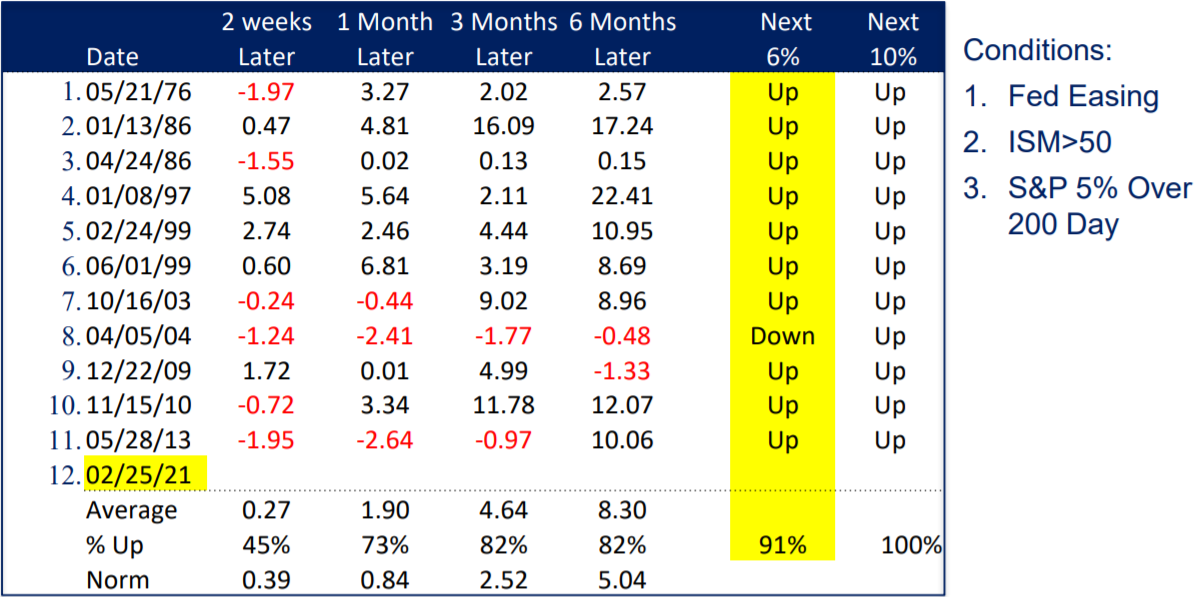
The 10-Year Treasury yield closed at 1.56% on March 5th, up over 1% from the August 2020 low, and up 0.5% in just the last 6 weeks. This made headlines because it’s the biggest move since 2016. But in fact, it is not unusual. There were 48 prior cases since 1970, occurring about once a year on average. Analyzing all the cases, equity returns showed no consistent trend. However, context is important. When we isolate those cases with a strong economy, easing Federal Reserve and strong stock market like we have today, forward equity returns were positive. 3 months out the S&P 500 was up an average of 4.6%, almost 2x the norm.
10-Year Treasury Yield vs. S&P 500
S&P 500 Returns After Prior Cases
Gold Down 18% from August Peak: Normal Volatility
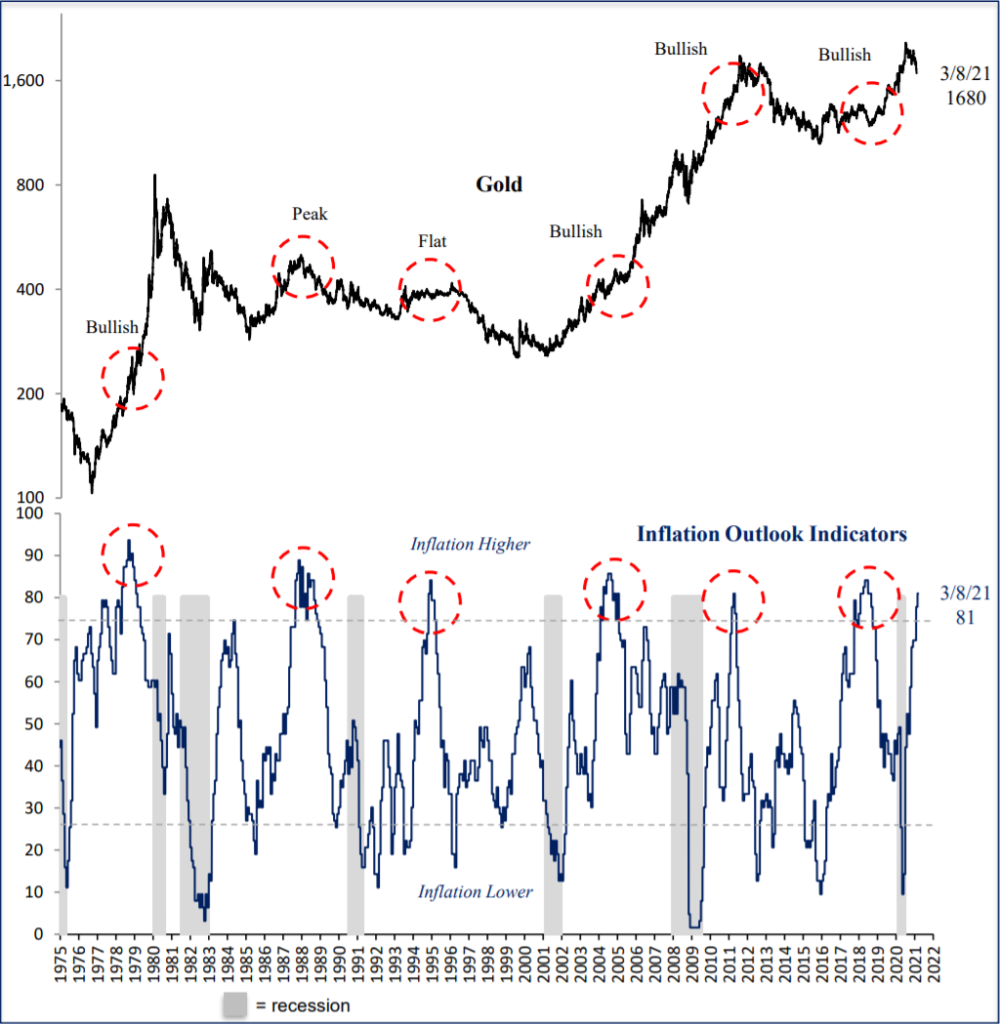
Through March 8th, gold had declined 18% from the August peak. During the 2000-2011 bull market there were 8 separate 10% declines, so they are not unusual. Since the 2018 gold low, this is just the 2nd 10% decline. Popular reasons cited are the rise in the 10-year yield and bitcoin as a gold alternative. Historically, a rising 10-year yield was negative for gold prices, but higher expected inflation and a weaker dollar are offsets. Bitcoin is certainly seen as an alternative, particularly for younger investors, but with only 12 years of history, it is difficult to assess bitcoin’s risk/reward compared to gold with 2600 years as a currency. Finally, early March is the worst period of the year for gold historically. For instance, gold was higher just 29% of the time in the first half of March compared to 57% for the second half. It may explain some of the recent selling pressure, perhaps by some institutions or central banks with scheduled sales.
Gold Down 18% from Peak: Normal Bull Market Reversal

Higher Inflation Outlook Indicators: Positive for Gold: 4 of 6 Cases Higher
Bond Investor Positioning: Not Extreme
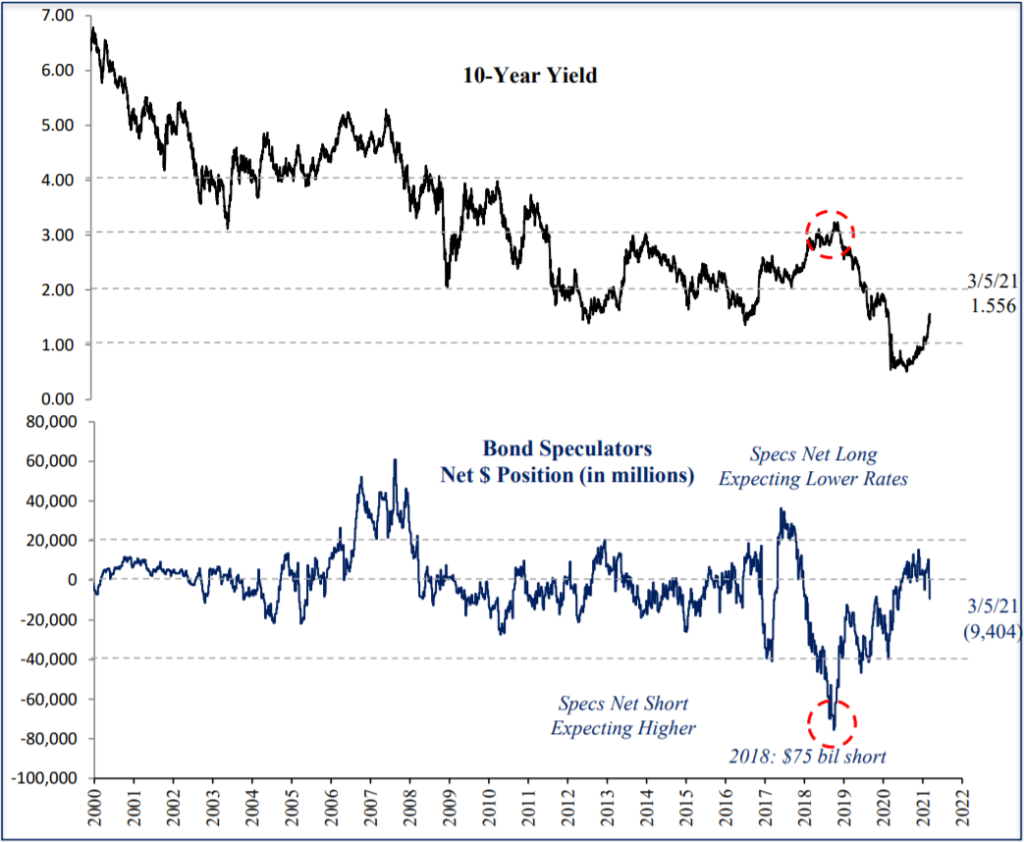
Despite the decline in bond prices for 7 months since the August low (as the 10-year yield has risen), bond investor positioning is surprisingly still neutral. For instance, futures speculators just moved from net long to net short last week. Their $9 billion net short position is just 12% of the $75 billion net short position in 2018 when the 10-year yield was 3%. By this measure, the bond move is not yet “crowded” and could have further to go.
Bond Speculators Neutral: 2000-2021
10-Year Yields vs. Inflation: Not Yet Attractive
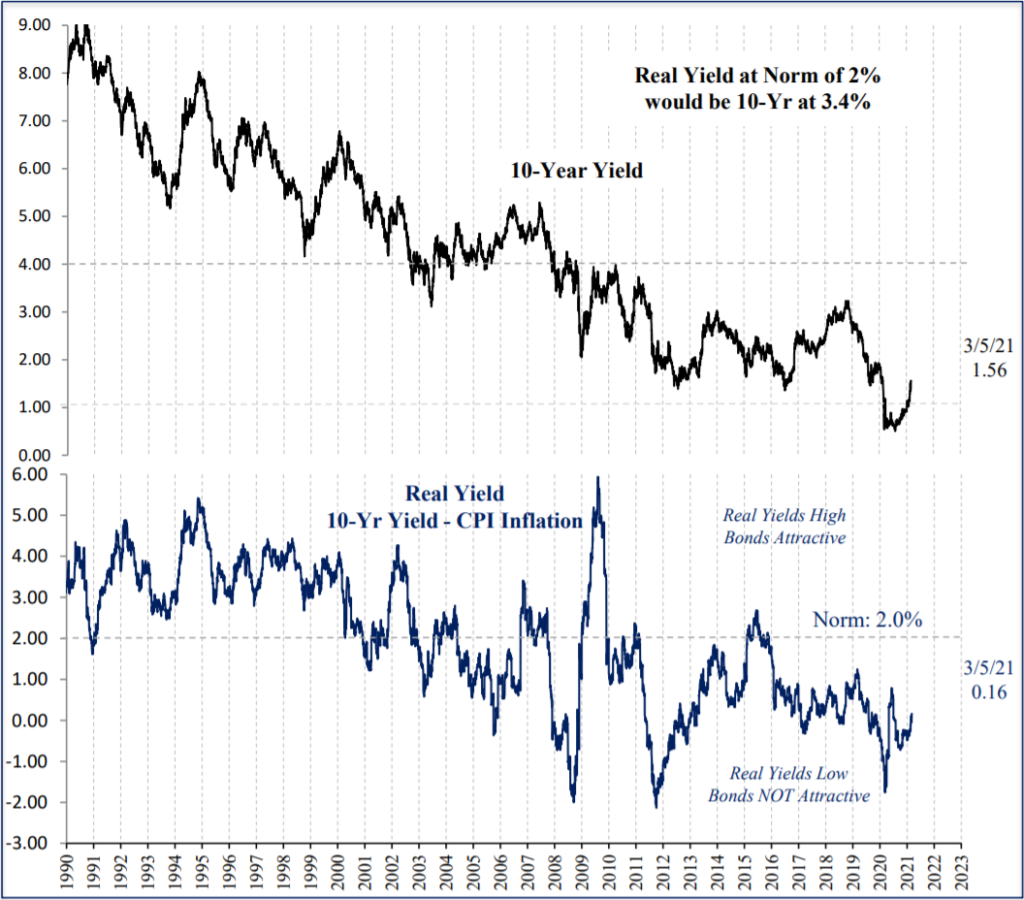
The 10-year yield move is extreme according to headlines. But is it really? At 1.56%, the 10-year yield is just 0.1% above the most recent inflation rate. The higher this real yield is, the more compelling bonds are to investors. In this case it’s just the 15th percentile of readings since 1990. For comparison, in early 2009, the 10-year yield was 6% above the inflation rate. Just to reach the real yield norm of 2%, the 10-year yield would have to climb to 3.4%, over double the rate today. And if inflation moves higher as we expect, that means bond yields have even further to go on the upside to normalize.
Real 10-Yr Yield is Still Low
10-Year Yield vs. Equity Earnings Yield: Not Extreme
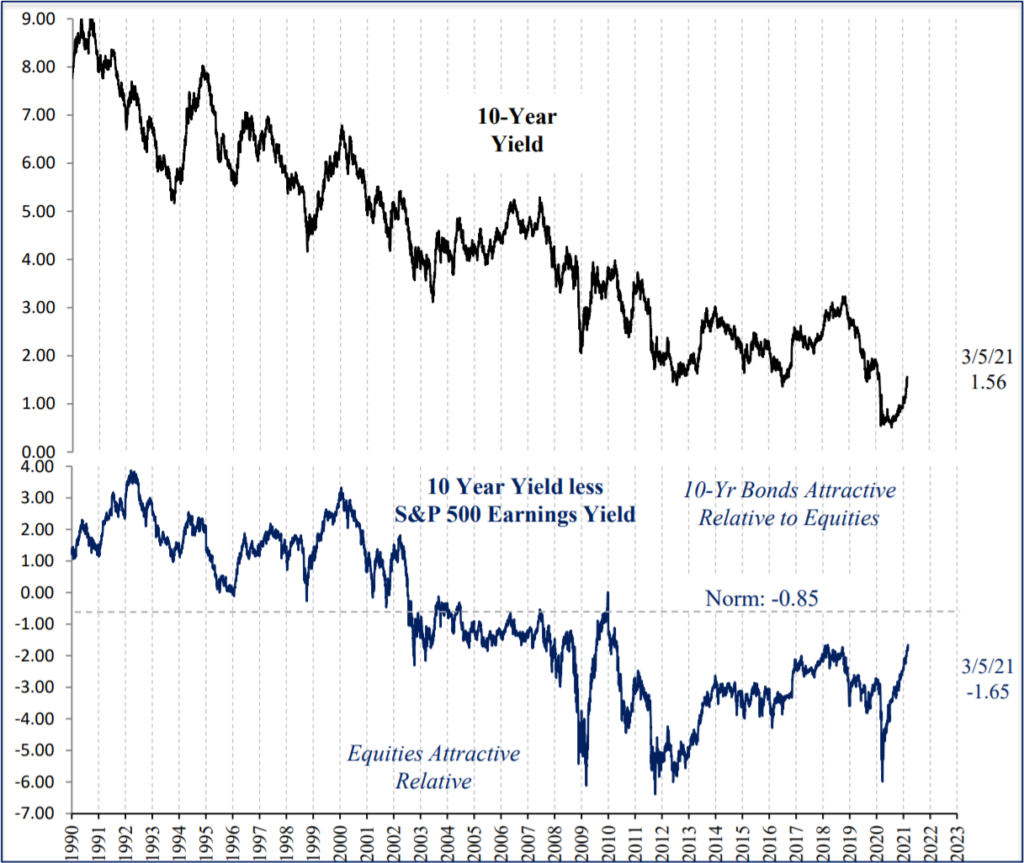
Another comparison of bond yields is to the earnings “yield” of the S&P 500, currently at 3.2%, the inverse of the price earnings ratio. This means for every $100 of stocks you own, earnings will total $3.20. The 10-year yield is 1.6% below the earnings yield, which is still below the norm since 1990. For comparison, in January 2000, the 10-year yield was 3.0% OVER the earnings yield, offering investors a reason to sell stocks and buy bonds. Today that is not the case, another reason bond yields at current levels are not extreme.
10-Yr Bonds vs. Equities: Bonds Not Yet Attractive
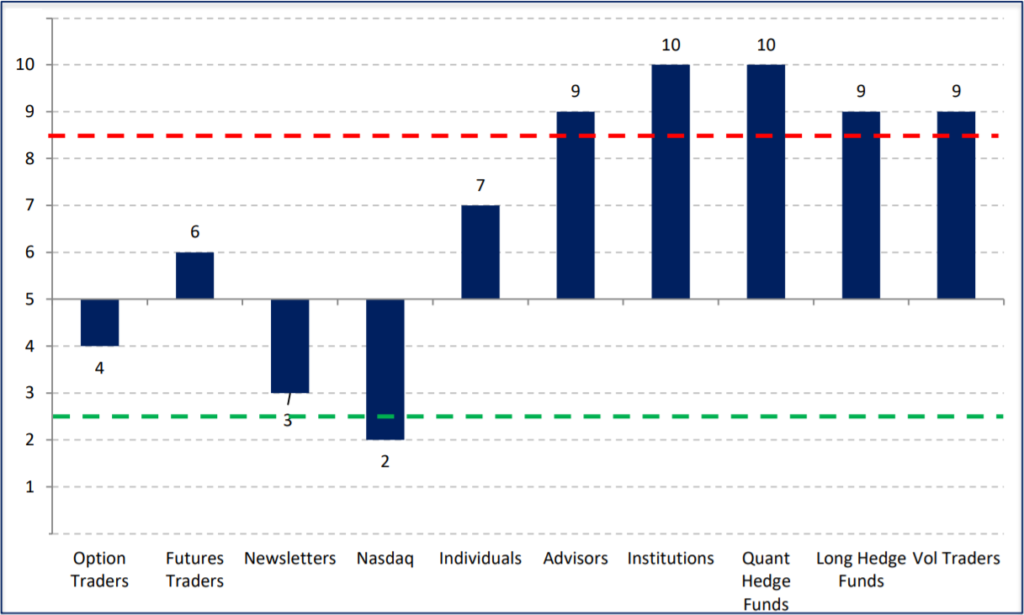
Equity Investor Positioning Moderated
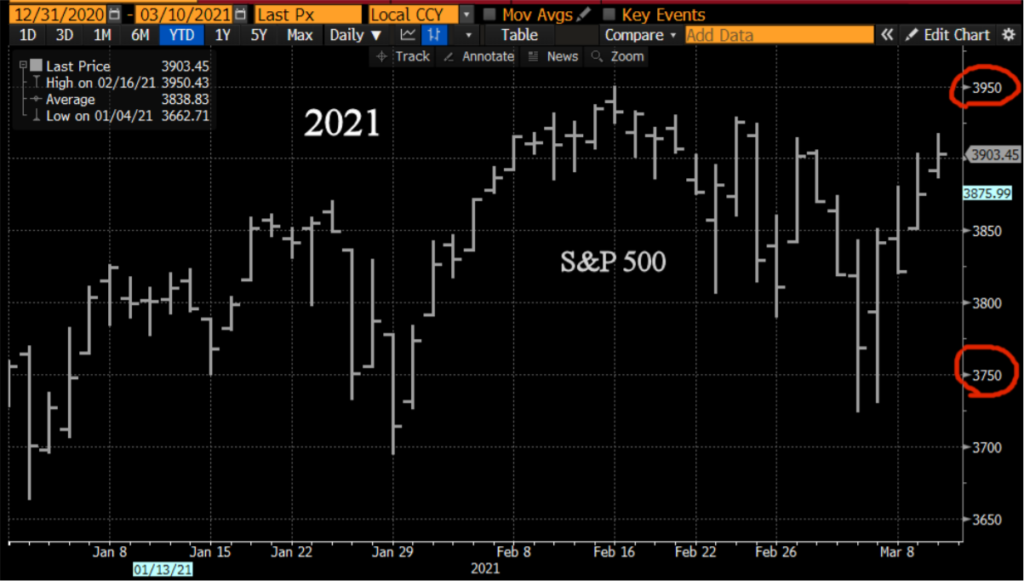
Last month we discussed the extreme investor positioning in equities. Since then, the S&P 500 declined 4.2% through March 4th and the Nasdaq Composite declined 10.5% through March 8th, declines similar to prior cases where positioning had been extreme in Q1. Both the S&P 500 and the Nasdaq reversed back to flat YTD. As a result, investor positioning was reduced out of the extreme zone and is no longer a significant factor for equities either way.
S&P 500
Equity Investor Positioning Moderated in March 5 of 10 Groups Extreme
Summary
The passage of the stimulus bill and the success of the COVID vaccination program has accelerated the U.S. into the Boom phase of the economic cycle, characterized by a strong economy, surging commodity prices, higher inflation, rising interest rates and extreme investor positioning by some groups. Equities can rally despite rising long-term rates as long as the economic outlook is strong and the Federal Reserve continues to ease, conditions we are seeing today. Since companies can raise prices and protect their profit margins, equities are actually a good hedge against inflation. Gold is also a good hedge against inflation historically, despite the recent volatility. However, once the Federal Reserve tightens policy, equity returns can deteriorate quickly. We are watching the Fed and our other indicators on a daily basis for any changes. Thank you for your support, and please contact your advisor with any questions.
IMPORTANT DISCLOSURES
This review and outlook report (this “Report”) is for informational, illustration and discussion purposes only and is not intended to be, nor should it be construed as, financial, legal, tax or investment advice, of Brenton Point Wealth Advisors LLC or any of its affiliates (“Brenton Point”). This Report does not take into account the investment objectives, financial situation, restrictions, particular needs or financial, legal or tax situation of any particular person and should not be viewed as addressing any recipient’s particular investment needs. Recipients should consider the information contained in this Report as only a single factor in making an investment decision and should not rely solely on investment recommendations contained herein, if any, as a substitution for the exercise of independent judgment of the merits and risks of investments.
This material is based upon information obtained from various sources that Brenton Point believes to be reliable, but Brenton Point makes no representation or warranty with respect to the accuracy or completeness of such information. Views expressed herein are current only as of the date indicated and are subject to change without notice.
This Report contains certain forward looking statements opinions, estimates, projections, assessments and other views (collectively “Statements”). These Statements are subject to a number of assumptions, risks and uncertainties which may cause actual results, performance or achievements to be materially different from future results, performance or achievements expressed or implied by these forward looking statements and projections. Brenton Point makes no representations as to the reasonableness of such assumptions or the likelihood that such assumptions will coincide with actual events and this information should not be relied upon for that purpose. Changes in such assumptions could produce materially different results. Past performance is not a guarantee or indication of future results, and no representation or warranty, express or implied, is made regarding future performance of any financial instrument mentioned in this Report.
Any benchmark shown herein is shown for illustrative purposes only. No index benchmark is available for direct investment. It may not be possible to replicate the returns of any index, as the index may not include any trading commissions and costs or fees, may assume the reinvestment of income, and may have investment objectives, use trading strategies, or have other materials characteristics, such as credit exposure or volatility, that do not make it suitable for a particular person. This is not an offer or solicitation for the purchase or sale of any security, investment, or other product and should not be construed as such. References to specific financial instruments and to certain indices are for illustrative purposes only and provided for the purpose of making general market data available as a point of reference only; they are not intended to be, and should not be interpreted as recommendations to purchase or sell such securities. Investing in securities and other financial products entails certain risks, including the possible loss of the entire principal amount invested, as the value of investment can go down as well as up. You should obtain advice from your tax, financial, legal, and other advisors and only make investment decisions on the basis of your own objectives, experience, and resources.
Brenton Point accepts no liability for any loss (whether direct, indirect or consequential) occasioned to any person acting or refraining from action as a result of any material contained in or derived from this Report, except to the extent (but only to the extent) that such liability may not be waived, modified or limited under applicable law.
This Report may provide addresses of, or contain hyperlinks to, Internet websites. Brenton Point has not reviewed the linked Internet website of any third party and takes no responsibility for the contents thereof. Each such address or hyperlink is provided solely for your convenience and information, and the content of linked third party websites is not in any way incorporated herein. Recipients who choose to access such third-party websites or follow such hyperlinks do so at their own risk.
All marks referenced herein are the property of their respective owners. This Report is licensed for non-commercial use only, and may not be reproduced, distributed, forwarded, posted, published, transmitted, uploaded or otherwise made available to others for commercial purposes, including to individuals within an institution, without written authorization from Brenton Point.
Source of data and performance statistics: Bloomberg L.P. and Factset Research Systems Inc.
©Brenton Point Wealth Advisors LLC 2021

Michael Schaus
Director of Market Research
Michael Schaus is the Director of Market Research for Brenton Point Wealth Advisors and Zweig-DiMenna. Since joining Zweig-DiMenna in 1992, his focus has been on macroeconomic research, the analysis of…
READ MORE
Sign up!
Sign up for our monthly newsletter and get the lastest news and research from our esteemed advisors here at Brenton point. Right into your inbox!