 Client Login

May Unemployment Rate Surprise: Economy Stronger than Expected
We raised the equity ratings to 5 for U.S. stocks, foreign developed, and emerging markets, based on growing evidence the economy could surprise and rebound strongly to the upside in the second half of the year. The wide breadth of signals includes commodity rallies (in copper, crude oil and iron ore), stock rallies like the Russell 2000 in the U.S., strong Asian stocks in Japan and South Korea, and a recent turn higher in the 10-year Treasury yield. The strong economic outlook, combined with unprecedented Fed and Fiscal stimulus, and finally bullish technical market signals, give us confidence the economic recovery and a new bull market cycle are under way. We cut our long-term bond rating to a 1 based on expectations of higher long-term yields, typical as the economy strengthens. With stronger than expected industrial demand and a weaker dollar, we also raised our commodity rating to a bullish 5.
May Unemployment Rate Surprise: Economy Stronger than Expected

Chart 1:Recession Unemployment Rate Peaks: 13.3% in May vs. 14.7% in April

Russell 2000 Outperformance: Bullish for Economy
The Russell 2000 (small-cap stock index) has outperformed the S&P 500 by 12% since April 16th. There were only 3 prior cases of such outperformance when the economy was in a recession with the ISM index below 45 as it is today. Prior cases in November 1982, March 1991 and April 2009 marked the end of the recession and confirmed a new multi-year bull market in stocks. Small capitalization stocks had been underperforming the larger cap S&P 500 stocks since 2018 by the biggest margin since 2000. This could also mark a multi-year reversion period where small cap stocks outperform the S&P 500 as we saw from 1991-1994.
Chart 2:Russell 2000 Outperformance Bullish For Economy: 1979 – 2020

Consumer Spending Rebound: Economy Recovering Fast
Despite the COVID-19 pandemic, high frequency economic reports show consumer spending has rebounded quickly. For instance, Bank of America (BAC) reported as of 5/29/20 total credit and debit card spending is down just 10% Y/Y from a low of -40% in April. This is evidence that people and businesses are adapting quickly to the COVID-19 pandemic, with better odds that even a second wave of infections will not hold the economy back. It also shows that pent up demand is real, particularly with strong unemployment benefits filling the gap.
Chart 3:Daily Total Credit Card Spending by Income Group Based on BAC Aggregate Card Data (% YoY, 3-day moving average)

Don’t Fight the Tape: One Month Thrust is Bullish
Marty Zweig coined the phrase, “Don’t Fight the Tape.” Since the March 23rd low, we have seen extremely strong tape (the rally in stocks). For instance, on April 14th the S&P 500 was up 27% within a month, up so sharply it was 10% above the one-month average, known as a one-month thrust. There were only 8 prior times this happened since 1928, and only 2 since 1950, in August 1982 and April 2009. After these two cases the S&P was up a further 30% in 6 months and 40% in a year. So far since that April 14th signal, the S&P 500 is following the pattern of those two cases with a one-month consolidation phase followed by the most recent leg higher. These two cases were 30% higher after 6 months and up 40% a year later.
Chart 4: One-Month Thrusts: 2 Prior Post War Cases: Sep 1982/Mar 2009

Zero Rates are Bullish for Equities
The Federal Reserve cut the Fed Funds target rate to zero on March 16th. Although much focus is on the direct stimulus through balance sheet purchases, zero interest rates are bullish for financial assets, since it lowers the cost of capital for all projects and stimulates investment. The only prior cases of zero rates began in 1932 and 2009, both of which were followed by multi-year bull markets.
Chart 5: Zero Interest Rates are Bullish: T-Bill Yield since 1926

Equity Investors Positioning Neutral
Equity sentiment shows investor groups are getting more fully invested as the market rallies but remains mixed overall. Options and futures traders are the most bullish, but these are balanced by other groups like individuals and institutions who are still underinvested. When most of the groups are long, another consolidation phase (trading range) for stocks will be more likely.
Chart 6: Equity Investor Positioning: 10 Investor Groups

Bond Ranking Cut to 1 / Commodity Ranking Raised to Bullish 5
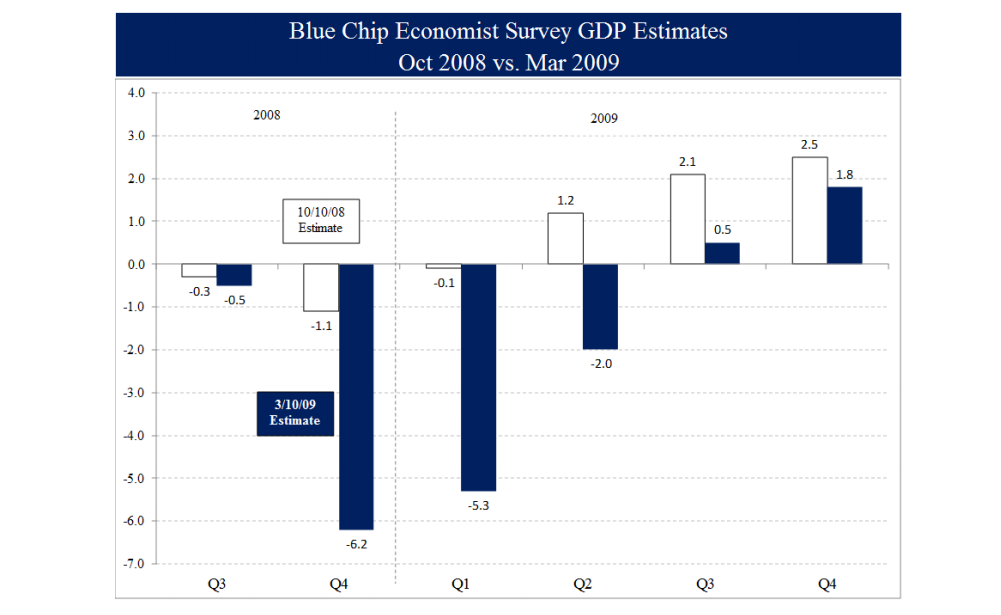
We cut our long-term bond ranking to a 1 based on expectations long term interest rates will rise as the economy strengthens. For the same reason, we raised our commodity rating to a bullish 5. The 10-year Treasury yield and commodity prices, like copper and crude, typically fall sharply ahead of a recession then rebound sharply to the upside prior to an economic recovery. You can see that pattern clearly around the Global Financial Crisis in 2008. So far this year the pattern is similar, with crude and copper higher and the 10-year yield just starting to rise. The rally in commodities this year is also boosted by the 6% decline in the dollar since March. During the last economic recovery, the dollar declined 16% in 2009 while crude oil doubled, and copper tripled in price. Since commodities are priced in dollars, a weaker dollar increases the demand and the price goes higher.
Chart 7: Crude Oil vs. 10-Year Treasury Yield

Summary
With a sharply improved economic outlook, there’s a better chance the equity bear market ended in March and we have entered the Goldilocks phase of the economic cycle, the best stage for equities. Economic growth combined with a loose Fed, benign inflation and skeptical investors is a bullish combination historically. The biggest unknown is the outcome of the COVID-19 pandemic. Although a 2nd wave is likely, it appears that the economy will still accelerate as people and businesses are adapting quickly. Strong pent up demand combined with Fed and fiscal stimulus will likely overcome pandemic issues. Hong Kong and now U.S. protests are dominating headlines with serious political consequences, but so far, they do not appear to be an economic issue, and therefore, are less relevant for asset returns. The presidential election is another big unknown, with taxes likely going higher. During prior presidential election years, June was a strong month up 82% of the time since 1950, followed by more mixed returns in July to September as the campaigns and rhetoric heat up. For instance, July returns were positive just 47% of the time. We will continue to watch for indicator changes, but for now conditions are extremely positive for stocks. It is important to expect 5-10% declines in stocks, as they are normal even when conditions are positive. Thank you for your support and please contact your advisor with any questions.
IMPORTANT DISCLOSURES
This review and outlook report (this “Report”) is for informational, illustration and discussion purposes only and is not intended to be, nor should it be construed as, financial, legal, tax or investment advice, of Brenton Point Wealth Advisors LLC or any of its affiliates (“Brenton Point”). This Report does not take into account the investment objectives, financial situation, restrictions, particular needs or financial, legal or tax situation of any particular person and should not be viewed as addressing any recipient’s particular investment needs. Recipients should consider the information contained in this Report as only a single factor in making an investment decision and should not rely solely on investment recommendations contained herein, if any, as a substitution for the exercise of independent judgment of the merits and risks of investments.
This material is based upon information obtained from various sources that Brenton Point believes to be reliable, but Brenton Point makes no representation or warranty with respect to the accuracy or completeness of such information. Views expressed herein are current only as of the date indicated and are subject to change without notice.
This Report contains certain forward looking statements opinions, estimates, projections, assessments and other views (collectively “Statements”). These Statements are subject to a number of assumptions, risks and uncertainties which may cause actual results, performance or achievements to be materially different from future results, performance or achievements expressed or implied by these forward looking statements and projections. Brenton Point makes no representations as to the reasonableness of such assumptions or the likelihood that such assumptions will coincide with actual events and this information should not be relied upon for that purpose. Changes in such assumptions could produce materially different results. Past performance is not a guarantee or indication of future results, and no representation or warranty, express or implied, is made regarding future performance of any financial instrument mentioned in this Report.
Any benchmark shown herein is shown for illustrative purposes only. No index benchmark is available for direct investment. It may not be possible to replicate the returns of any index, as the index may not include any trading commissions and costs or fees, may assume the reinvestment of income, and may have investment objectives, use trading strategies, or have other materials characteristics, such as credit exposure or volatility, that do not make it suitable for a particular person. This is not an offer or solicitation for the purchase or sale of any security, investment, or other product and should not be construed as such. References to specific financial instruments and to certain indices are for illustrative purposes only and provided for the purpose of making general market data available as a point of reference only; they are not intended to be, and should not be interpreted as recommendations to purchase or sell such securities. Investing in securities and other financial products entails certain risks, including the possible loss of the entire principal amount invested, as the value of investment can go down as well as up. You should obtain advice from your tax, financial, legal, and other advisors and only make investment decisions on the basis of your own objectives, experience, and resources.
Brenton Point accepts no liability for any loss (whether direct, indirect or consequential) occasioned to any person acting or refraining from action as a result of any material contained in or derived from this Report, except to the extent (but only to the extent) that such liability may not be waived, modified or limited under applicable law.
This Report may provide addresses of, or contain hyperlinks to, Internet websites. Brenton Point has not reviewed the linked Internet website of any third party and takes no responsibility for the contents thereof. Each such address or hyperlink is provided solely for your convenience and information, and the content of linked third party websites is not in any way incorporated herein. Recipients who choose to access such third-party websites or follow such hyperlinks do so at their own risk.
All marks referenced herein are the property of their respective owners. This Report is licensed for non-commercial use only, and may not be reproduced, distributed, forwarded, posted, published, transmitted, uploaded or otherwise made available to others for commercial purposes, including to individuals within an institution, without written authorization from Brenton Point.
Source of data and performance statistics: Bloomberg L.P. and Factset Research Systems Inc.
©Brenton Point Wealth Advisors LLC 2020

Michael Schaus
Director of Market Research
Michael Schaus is the Director of Market Research for Brenton Point Wealth Advisors and Zweig-DiMenna. Since joining Zweig-DiMenna in 1992, his focus has been on macroeconomic research, the analysis of…
READ MORE
Sign up!
Sign up for our monthly newsletter and get the lastest news and research from our esteemed advisors here at Brenton point. Right into your inbox!