 Client Login

Perfect Storm
Investing Environment Review and Outlook – Volume 57
Perfect Storm
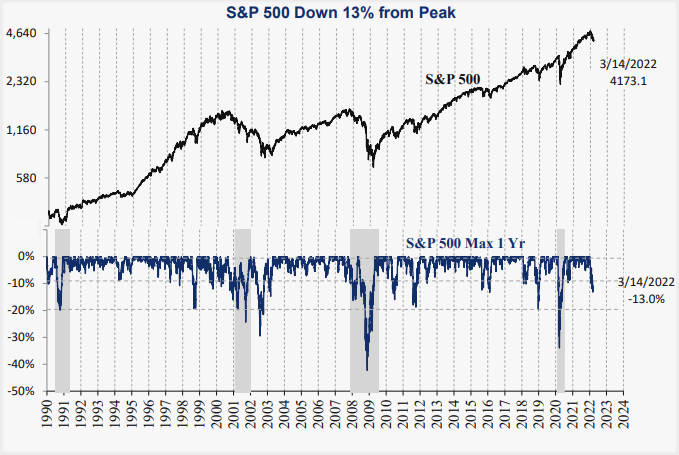
Markets entered a perfect storm this year. After we had finally learned to cope with COVID, we are now confronting 7.9% inflation, war in Europe, renewed supply chain bottlenecks, commodity price spikes like oil to $130, and a regime change at the Federal Reserve. Add to that the humanitarian disaster unfolding in Ukraine. Despite these challenges and talk about recessions and bear markets, the S&P 500 has so far only declined 13% on the 3/14/22 low, in line with prior declines since 2010. For perspective, during the 2009 – 2020 bull market, 5 larger declines occurred. In this issue we discuss the implications of the initial Fed interest rate hike, the crude oil price spike, extreme investor positioning, and inflation.
This month we raised the U.S. equity rating to a neutral 3 rating. Foreign-developed, emerging markets and gold remain a bullish 5 rating. Long-term bonds remain a cautious 1 and commodities are a neutral 3.
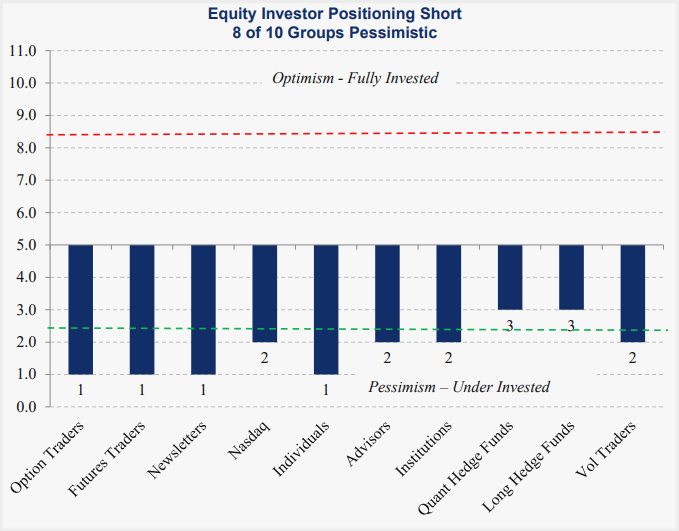
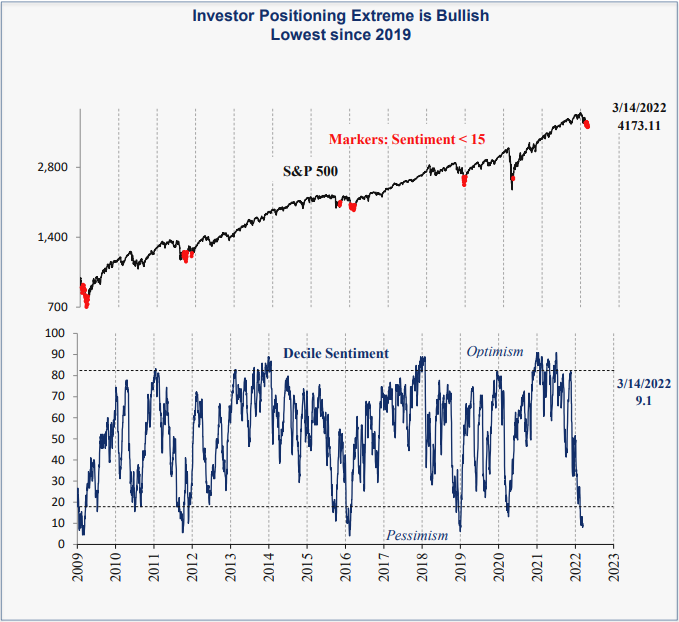
Equity Investor Positioning Extreme: Bullish
Due to the persistent negative headlines and price declines in both the S&P 500 and the Nasdaq, investor positioning has reached a further extreme this, with all investor groups bearish and likely underinvested after institutions, the last hold-out, capitulated this month. The current reading is even better than the March 2020 low. This means investors have excess liquidity available to drive the next rally. It also means the worst probable outcome is likely discounted in prices, lowering the bar for a positive surprise. In the 6 prior cases since 2010, sharp equity rallies followed. Next, we discuss two possible catalysts which may cause a reversion to the upside.
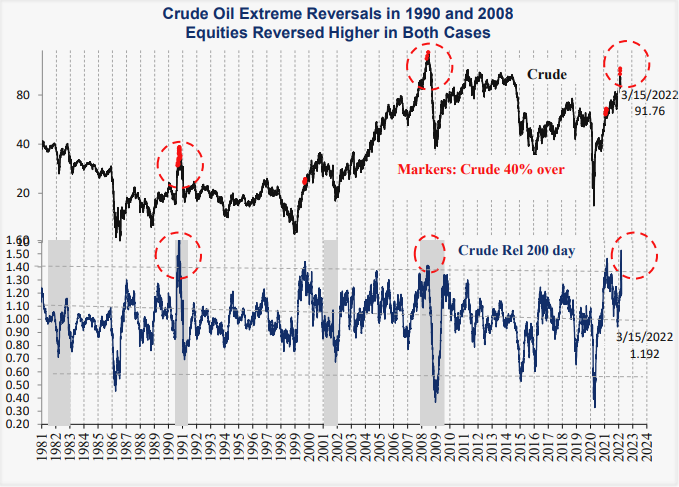
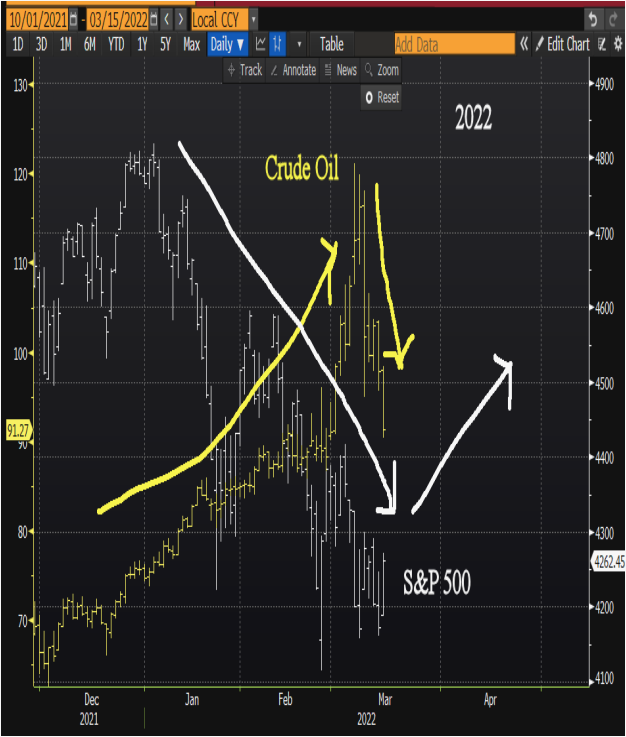
Equity Catalyst #1: Crude Oil Extreme
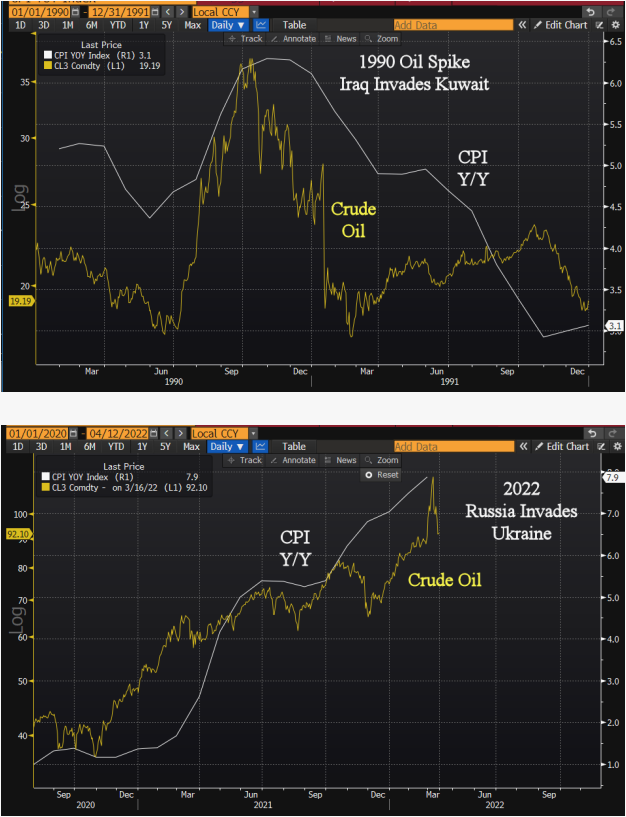
On 3/7/22 crude oil reached $130 a barrel and 50% above the 200-day average, an extreme not seen since 1990 after Iraq’s surprise invasion of neighboring Kuwait, quite similar in some ways to Russia’s Ukraine invasion. These types of extreme rallies are typically unsustainable, since they can indicate emotional or forced buying rather than a rational market assessment of supply and demand. In the 1990 case, the Kuwait invasion was followed by a decline in the S&P 500 as the oil price doubled to $40. Then on 10/11/90, without any particular news, the S&P 500 hit bottom the same day crude oil peaked. Despite the October reversal, there was no formal resolution of the invasion for three months until U.S. forces took control in January 1991. In other words, markets often turn well ahead of any significant news. This year, the recent 20% crude oil reversal from the 3/7/22 peak may be a similar signal for equities to reverse higher, with supporting news to follow in the coming weeks. The July 2008 crude oil extreme was also followed by an equity rally as well, although it only lasted 6 weeks with much larger systemic banking issues to deal with. Both of those cases marked the beginning of recessions. It is something we are watching closely, but odds are against it for now. When the Fed is hiking, an economic slowdown is a positive since it pulls inflation down and takes pressure off the Fed.
Equity Catalyst #2: Initial Fed Hike
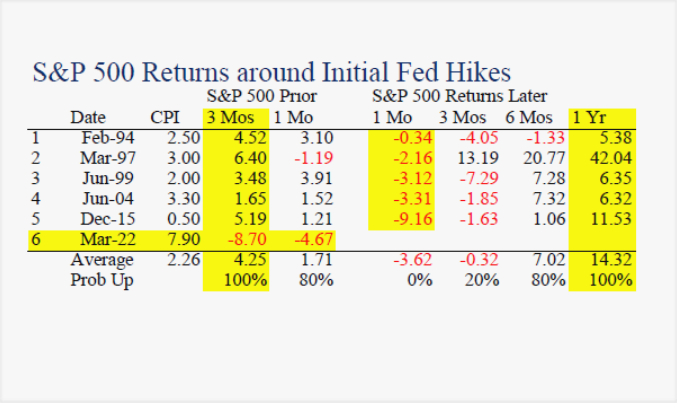
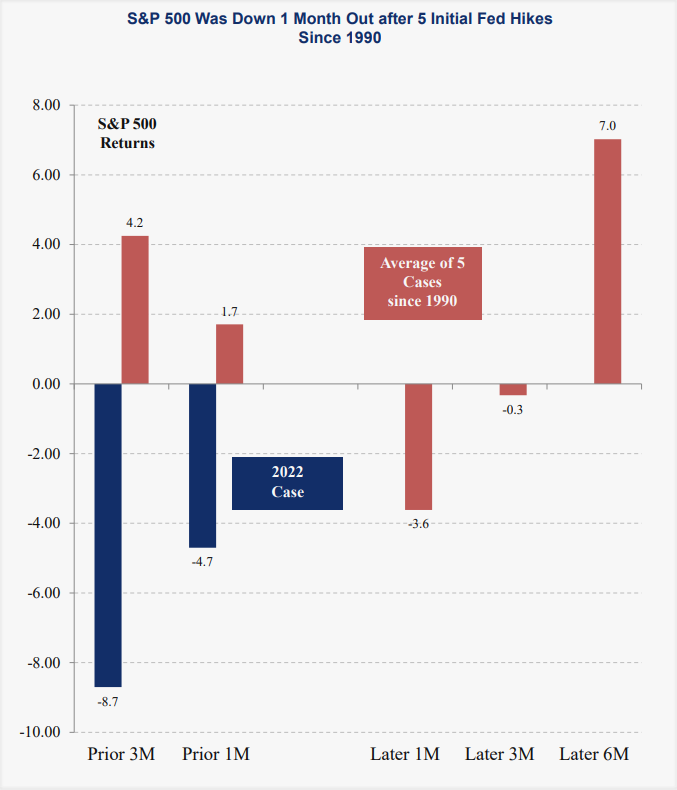
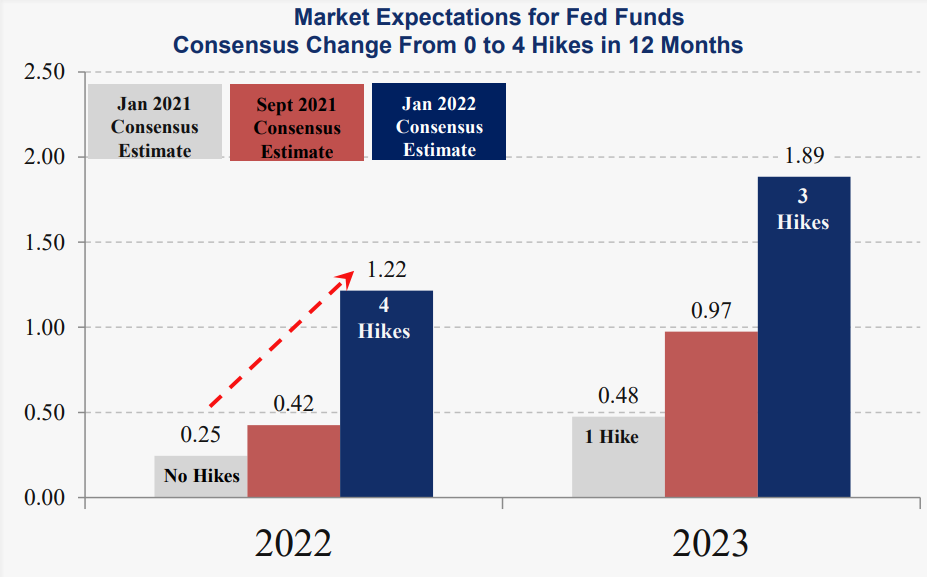
The Fed is expected to hike the Fed Funds target rate on 3/16/22. In the 5 prior initial hikes back to 1994, the S&P 500 was down every time, a month later, by an average of 3.6%. The worst decline within 3 months averaged 7.5%. Cases prior to 1994 are less comparable since moves were not telegraphed ahead of time to investors like they are today. This year there has been endless media discussion about the Fed, likely contributing to the first S&P 500 decline prior to an initial hike. The extreme investor positioning means the worst possible outcome is likely discounted, making it more likely the market will rally on the news rather than decline as it did historically. 6 months after initial hikes the average S&P 500 move was positive at +7% and +14% a year later. Future returns this year will largely depend on the direction of inflation. No prior cases had inflation over 4.0% vs. 7.9% this year as of February.
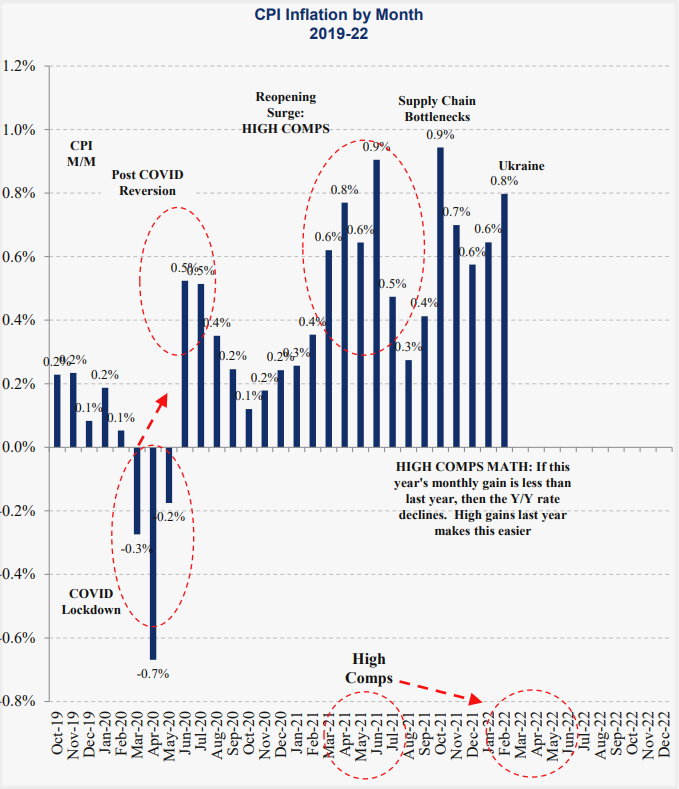
Inflation Direction Key for Equities: Watch Crude Oil
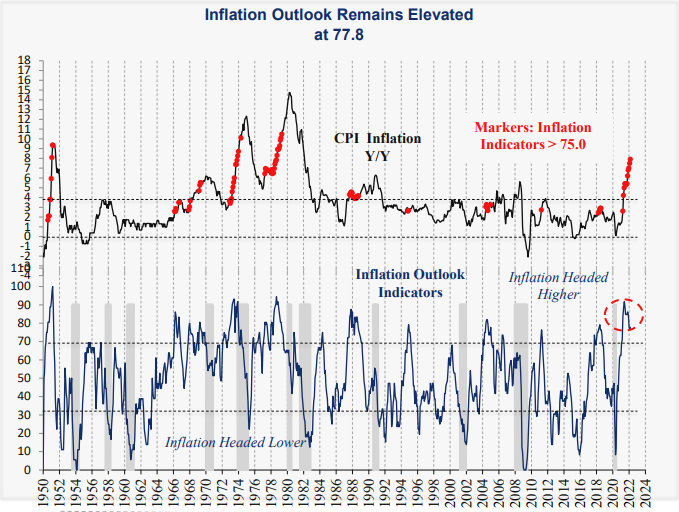
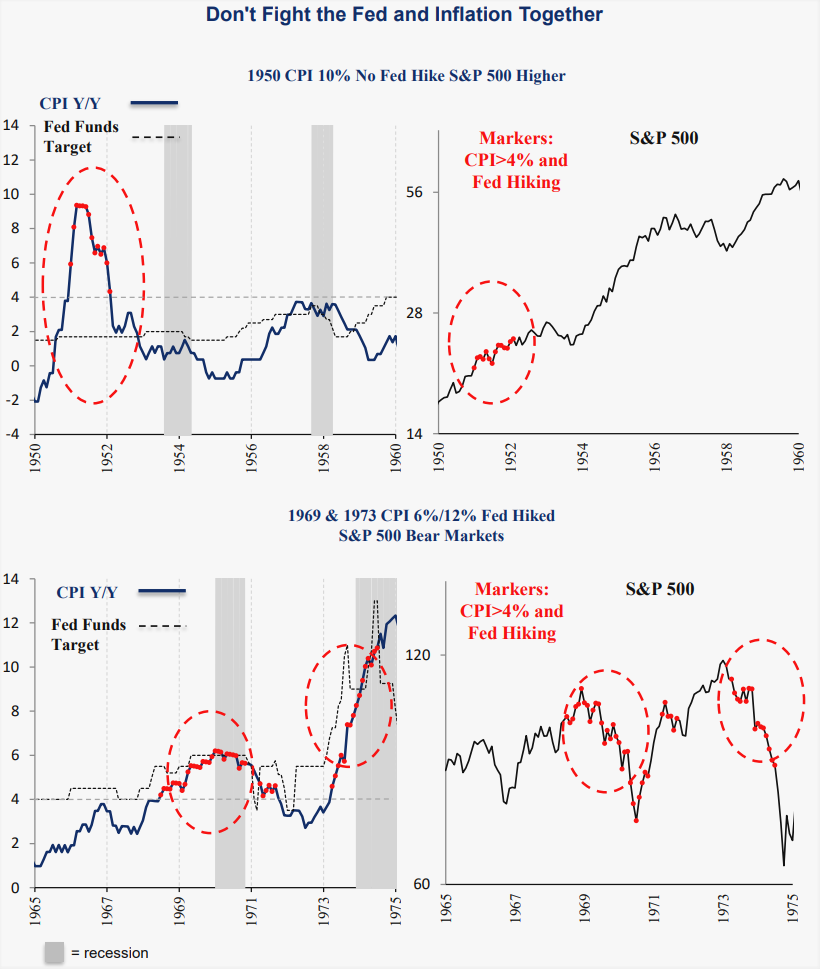
Inflation is a critical factor in determining the expected return for equities, since the worst combination is high and rising inflation while the Fed hikes rates. With this combination historically, the market generally declines because it discounts the fact the Fed has no real option to pause or reverse course. That is the bear case for equities and the reason we took the U.S. equity rating down to a 2 last month. However, the S&P 500 returned 14% annualized, better than the norm when the Fed was hiking while inflation was falling, even if it was high similar to today. Although our inflation outlook indicators remain elevated at 77, this month we have two offsets. First is the 20% decline in crude from the recent peak, which may continue lower if it follows the 1990 case. Energy is less important for inflation today than it was 30 years ago, but it remains a significant coincident indicator of CPI. The second point is high comps started a year ago in March, making it more likely the CPI Y/Y rate decreases as we go forward. For instance, even if monthly changes average 0.6% the rest of the year, CPI will end the year lower at 7.5%. If monthly changes average 0.3%, CPI will end the year at just 4.0% which would be a boost for equities.
Summary
This month we discussed the perfect storm that hit markets this year and specifically the implications of the war in Europe, crude oil spikes, and initial Fed hikes. Although there are significant negatives to contend with, markets are forward looking, so the extreme investor positioning may indicate the worst is already priced in, making an upside surprise more likely going
forward. The sharp crude oil reversal combined with the much anticipated initial Fed hike are likely catalysts for a reversion to the upside in equity prices. At times like this, we are testing the fast changing conditions for implications on an hourly basis. Thank you for your support and please contact us with any questions.
IMPORTANT DISCLOSURES
This review and outlook report (this “Report”) is for informational, illustration and discussion purposes only and is not intended to be, nor should it be construed as, financial, legal, tax or investment advice, of Brenton Point Wealth Advisors LLC or any of its affiliates (“Brenton Point”). This Report does not take into account the investment objectives, financial situation, restrictions, particular needs or financial, legal or tax situation of any particular person and should not be viewed as addressing any recipient’s particular investment needs. Recipients should consider the information contained in this Report as only a single factor in making an investment decision and should not rely solely on investment recommendations contained herein, if any, as a substitution for the exercise of independent judgment of the merits and risks of investments.
This material is based upon information obtained from various sources that Brenton Point believes to be reliable, but Brenton Point makes no representation or warranty with respect to the accuracy or completeness of such information. Views expressed herein are current only as of the date indicated and are subject to change without notice.
This Report contains certain forward looking statements opinions, estimates, projections, assessments and other views (collectively “Statements”). These Statements are subject to a number of assumptions, risks and uncertainties which may cause actual results, performance or achievements to be materially different from future results, performance or achievements expressed or implied by these forward looking statements and projections. Brenton Point makes no representations as to the reasonableness of such assumptions or the likelihood that such assumptions will coincide with actual events and this information should not be relied upon for that purpose. Changes in such assumptions could produce materially different results. Past performance is not a guarantee or indication of future results, and no representation or warranty, express or implied, is made regarding future performance of any financial instrument mentioned in this Report.
Any benchmark shown herein is shown for illustrative purposes only. No index benchmark is available for direct investment. It may not be possible to replicate the returns of any index, as the index may not include any trading commissions and costs or fees, may assume the reinvestment of income, and may have investment objectives, use trading strategies, or have other materials characteristics, such as credit exposure or volatility, that do not make it suitable for a particular person. This is not an offer or solicitation for the purchase or sale of any security, investment, or other product and should not be construed as such. References to specific financial instruments and to certain indices are for illustrative purposes only and provided for the purpose of making general market data available as a point of reference only; they are not intended to be, and should not be interpreted as recommendations to purchase or sell such securities. Investing in securities and other financial products entails certain risks, including the possible loss of the entire principal amount invested, as the value of investment can go down as well as up. You should obtain advice from your tax, financial, legal, and other advisors and only make investment decisions on the basis of your own objectives, experience, and resources.
Brenton Point accepts no liability for any loss (whether direct, indirect or consequential) occasioned to any person acting or refraining from action as a result of any material contained in or derived from this Report, except to the extent (but only to the extent) that such liability may not be waived, modified or limited under applicable law.
This Report may provide addresses of, or contain hyperlinks to, Internet websites. Brenton Point has not reviewed the linked Internet website of any third party and takes no responsibility for the contents thereof. Each such address or hyperlink is provided solely for your convenience and information, and the content of linked third party websites is not in any way incorporated herein. Recipients who choose to access such third-party websites or follow such hyperlinks do so at their own risk.
All marks referenced herein are the property of their respective owners. This Report is licensed for non-commercial use only, and may not be reproduced, distributed, forwarded, posted, published, transmitted, uploaded or otherwise made available to others for commercial purposes, including to individuals within an institution, without written authorization from Brenton Point.
Source of data and performance statistics: Bloomberg L.P. and Factset Research Systems Inc.
©Brenton Point Wealth Advisors LLC 2022

Michael Schaus
Director of Market Research
Michael Schaus is the Director of Market Research for Brenton Point Wealth Advisors and Zweig-DiMenna. Since joining Zweig-DiMenna in 1992, his focus has been on macroeconomic research, the analysis of…
READ MORERead Next:
Sign up!
Sign up for our monthly newsletter and get the lastest news and research from our esteemed advisors here at Brenton point. Right into your inbox!