 Client Login

Q4 Equity Rally: Not Extreme
Investing Environment Review and Outlook – Volume 77
- Q4 Equity Rally
- Zweig Breadth Thrust: Bullish
- CPI Inflation Turn: Consistent with Goldilocks
- 10-Year Yield Reversal: Bullish Equities
- Dollar Decline: Bullish Gold
Last month, we discussed the investment implications of the goldilocks economic conditions for U.S. equities and the oversold extreme in bonds. Since then, there were some big market moves in equities, rates and the dollar. This month, we discuss the investment implications of the recent Q4 equity rally, the Zweig Breadth Thrust, and turns in CPI inflation, the 10-year Treasury yield and the Dollar Index. U.S. equities, foreign-developed and emerging markets equities remain bullish 5 ratings. Long-term bonds remain a neutral 3 rating. Gold remains a bullish 5 rating. Industrial commodities remain a bullish 4 rating.
Q4 Equity Rally: Not Extreme
After declining 13% from the July peak to the 10/27/23 low, the S&P 500 rallied 9.6% in just 3 weeks through 11/17/23. For historical perspective, this move is in the top 1% of 3 week moves since 1950. It begs the question whether the market is overbought and might be a high-risk bear market rally as some have said. A Bloomberg headline on 11/20/23 read, “S&P 500 Rally May Be at Risk.” If we consider the 22 prior years that were up over 10% in the first half that we mentioned last month, the median Q4 return following the strong first half in those years was 7.4%. So far, in Q4 the S&P 500 has only rallied 5.3%, so this move is still below the norm for similar years.

Zweig Breadth Thrust: Bullish 12 Months Out
On 11/3/23 after a strong 10-day move higher in the S&P 500, an alternate version of Marty Zweig’s Breadth Thrust indicator was triggered. This is a technical measure using NYSE daily advances and declines over a 10-day period. The idea is such strong positive momentum following market weakness is indicative of institutional buying with more to come. After the prior 13 cases since 1950, the S&P 500 was up an average of 9%, 19% and 27% 3, 6 and 12 months later, over 3x the norm.

CPI Reversal: Bullish for Equities
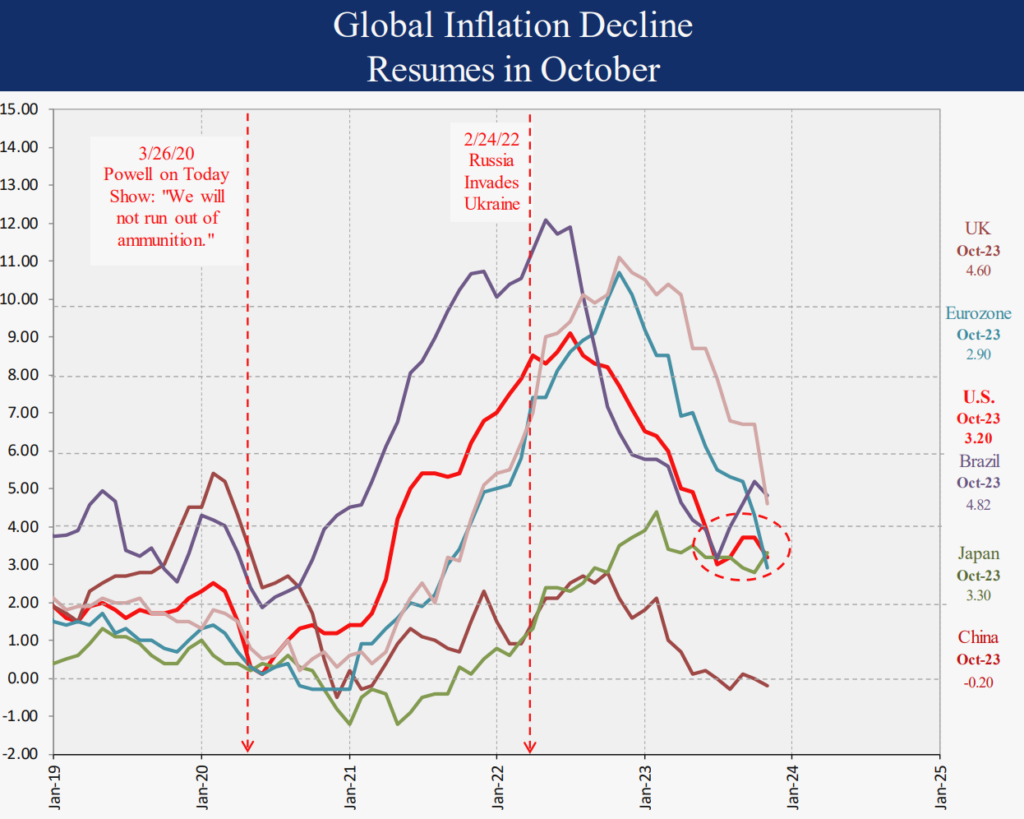
The October CPI Inflation report showed the Y/Y CPI declined to 3.2%, down from the August peak of 3.7%. That marks a trend change to the downside, and confirms the goldilocks conditions we discussed last month. Since 1950 the S&P 500 returned 18.8% annualized when the CPI was below 4% and falling, as it is now. This is not just a U.S. phenomenon, as most major countries around the world are experiencing lower inflation as well. The 10-year yield reversed also, from a September peak of 5% to 4.4% on 11/17/23. Since 1950, when the 10-year yield was falling like this, the S&P 500 returned 18.3% annualized, almost 2x the norm, even when the Fed was hiking rates. Returns were consistent over time as well.
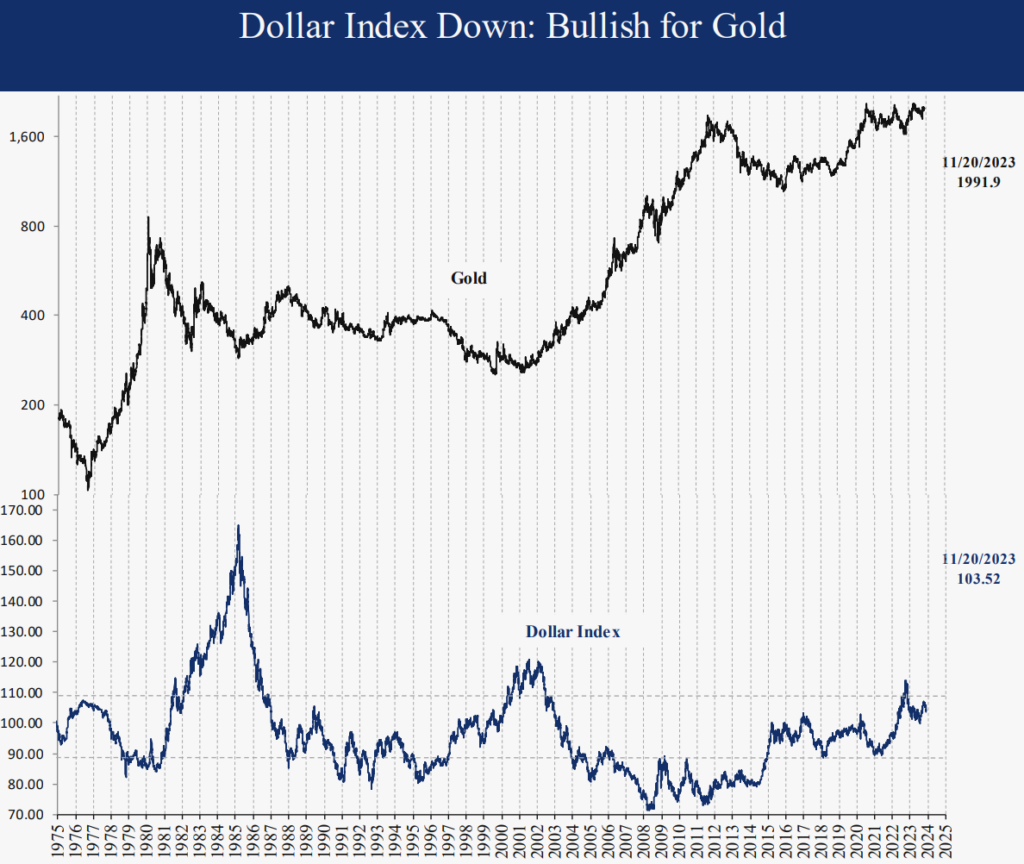
Dollar Index Down: Bullish for Gold
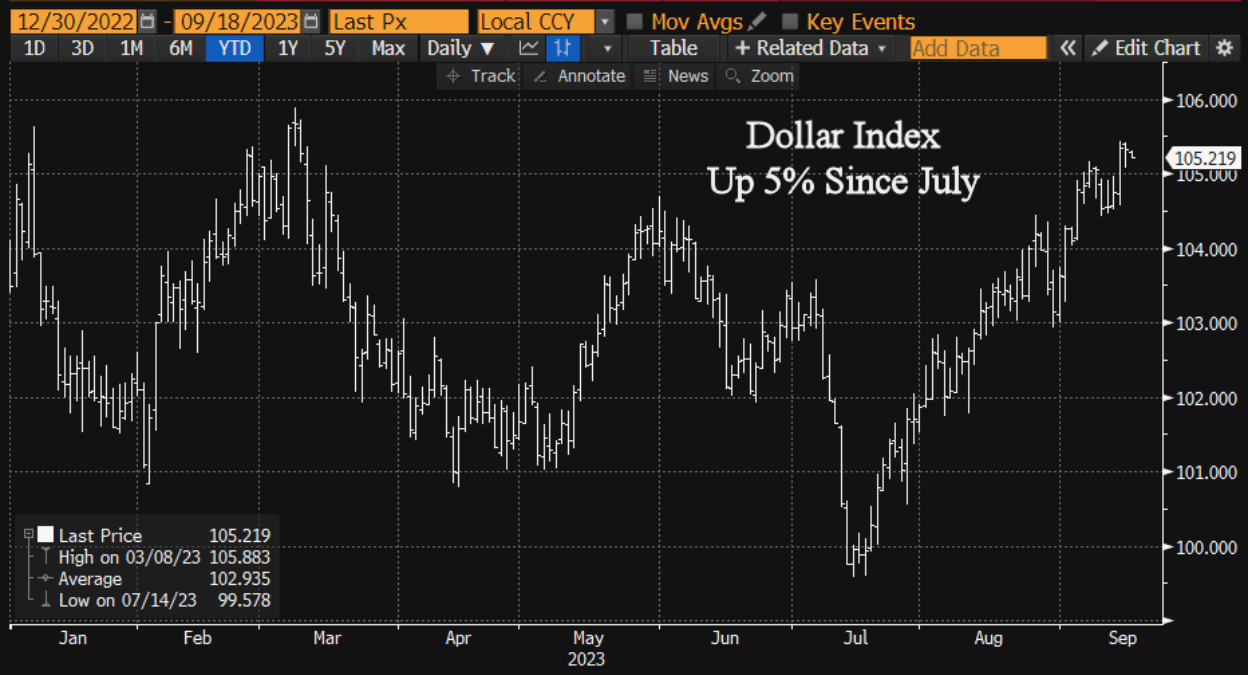
The Dollar Index made a 20-year peak of 115.0 in September 2022, before declining 15% into 2023. After a 7% rally since July, the Dollar Index is down 3.5% in a month and still down 10% from the 2022 peak. The weak dollar is a strong signal for gold historically. Since 1979, when the Dollar Index was weak and confirmed by a move higher in the Yen as we are seeing today, gold returned 17.7% annualized, over 3x the 4.9% norm over that period. Strong returns were also consistent over time, beating the buy/hold norm in every sub period since then. Our gold rating remains a bullish 5.
Summary
This month we discussed the Q4 equity rally, the Zweig Breadth Thrust, the CPI inflation turn and the weak Dollar Index. Economic conditions remain positive for equities both in the U.S. and abroad. Slow growth and falling inflation is consistently positive for equity returns despite the gloomy headlines. International equities remain under owned, and the dollar reversal could be the catalyst needed for a shift from the U.S. to abroad. We will continue to watch our indicators on a daily basis and shift exposures as needed to protect capital. Thank you for your support and please contact us with any questions.
IMPORTANT DISCLOSURES
This review and outlook report (this “Report”) is for informational, illustration and discussion purposes only and is not intended to be, nor should it be construed as, financial, legal, tax or investment advice, of Brenton Point Wealth Advisors LLC or any of its affiliates (“Brenton Point”). This Report does not take into account the investment objectives, financial situation, restrictions, particular needs or financial, legal or tax situation of any particular person and should not be viewed as addressing any recipient’s particular investment needs. Recipients should consider the information contained in this Report as only a single factor in making an investment decision and should not rely solely on investment recommendations contained herein, if any, as a substitution for the exercise of independent judgment of the merits and risks of investments.
This material is based upon information obtained from various sources that Brenton Point believes to be reliable, but Brenton Point makes no representation or warranty with respect to the accuracy or completeness of such information. Views expressed herein are current only as of the date indicated and are subject to change without notice.
This Report contains certain forward looking statements opinions, estimates, projections, assessments and other views (collectively “Statements”). These Statements are subject to a number of assumptions, risks and uncertainties which may cause actual results, performance or achievements to be materially different from future results, performance or achievements expressed or implied by these forward looking statements and projections. Brenton Point makes no representations as to the reasonableness of such assumptions or the likelihood that such assumptions will coincide with actual events and this information should not be relied upon for that purpose. Changes in such assumptions could produce materially different results. Past performance is not a guarantee or indication of future results, and no representation or warranty, express or implied, is made regarding future performance of any financial instrument mentioned in this Report.
Any benchmark shown herein is shown for illustrative purposes only. No index benchmark is available for direct investment. It may not be possible to replicate the returns of any index, as the index may not include any trading commissions and costs or fees, may assume the reinvestment of income, and may have investment objectives, use trading strategies, or have other materials characteristics, such as credit exposure or volatility, that do not make it suitable for a particular person. This is not an offer or solicitation for the purchase or sale of any security, investment, or other product and should not be construed as such. References to specific financial instruments and to certain indices are for illustrative purposes only and provided for the purpose of making general market data available as a point of reference only; they are not intended to be, and should not be interpreted as recommendations to purchase or sell such securities. Investing in securities and other financial products entails certain risks, including the possible loss of the entire principal amount invested, as the value of investment can go down as well as up. You should obtain advice from your tax, financial, legal, and other advisors and only make investment decisions on the basis of your own objectives, experience, and resources.
Brenton Point accepts no liability for any loss (whether direct, indirect or consequential) occasioned to any person acting or refraining from action as a result of any material contained in or derived from this Report, except to the extent (but only to the extent) that such liability may not be waived, modified or limited under applicable law.
This Report may provide addresses of, or contain hyperlinks to, Internet websites. Brenton Point has not reviewed the linked Internet website of any third party and takes no responsibility for the contents thereof. Each such address or hyperlink is provided solely for your convenience and information, and the content of linked third party websites is not in any way incorporated herein. Recipients who choose to access such third-party websites or follow such hyperlinks do so at their own risk.
All marks referenced herein are the property of their respective owners. This Report is licensed for non-commercial use only, and may not be reproduced, distributed, forwarded, posted, published, transmitted, uploaded or otherwise made available to others for commercial purposes, including to individuals within an institution, without written authorization from Brenton Point.
Source of data and performance statistics: Bloomberg L.P. and Factset Research Systems Inc.
©Brenton Point Wealth Advisors LLC 2023

Michael Schaus
Director of Market Research
Michael Schaus is the Director of Market Research for Brenton Point Wealth Advisors and Zweig-DiMenna. Since joining Zweig-DiMenna in 1992, his focus has been on macroeconomic research, the analysis of…
READ MORE
Sign up!
Sign up for our monthly newsletter and get the lastest news and research from our esteemed advisors here at Brenton point. Right into your inbox!