After the Banking Panic
Investing Environment Review and Outlook – Volume 70
After the Banking Panic
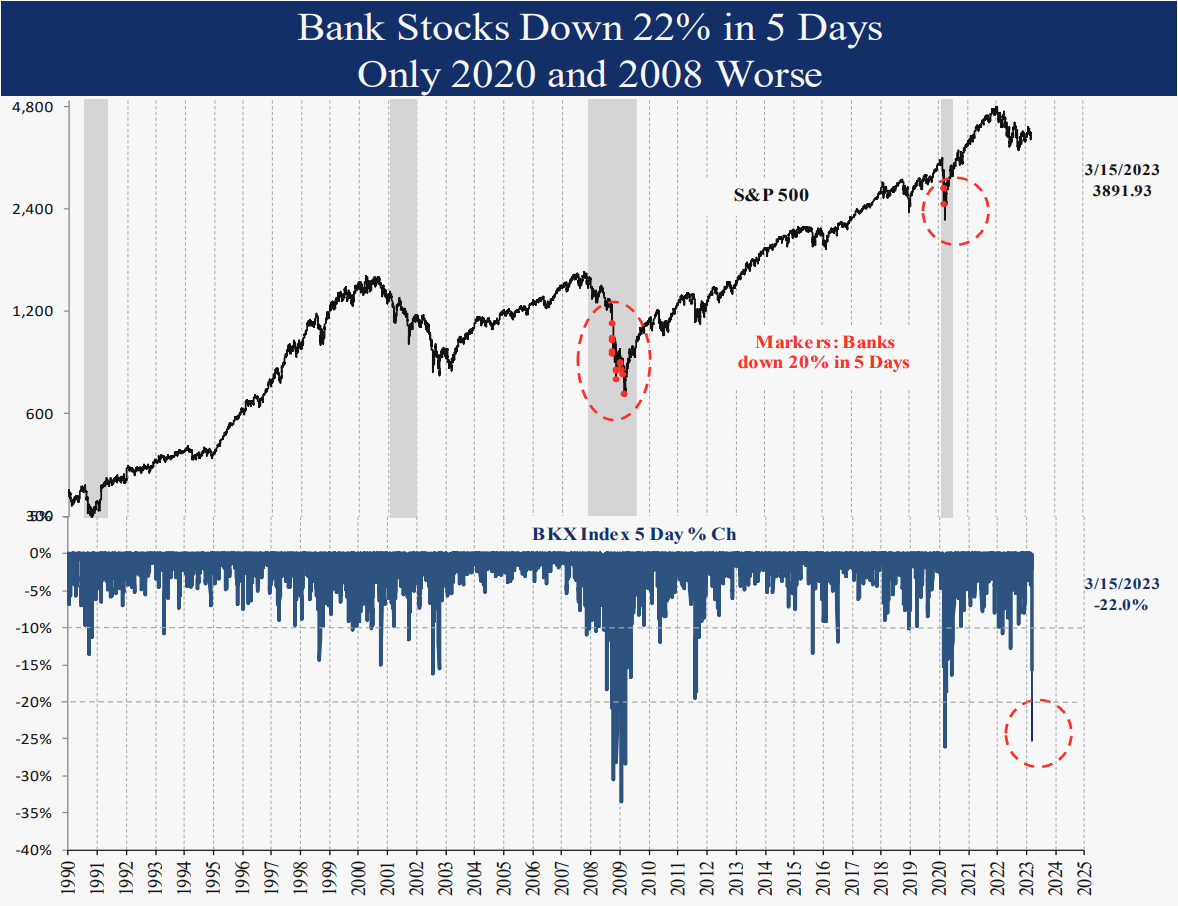
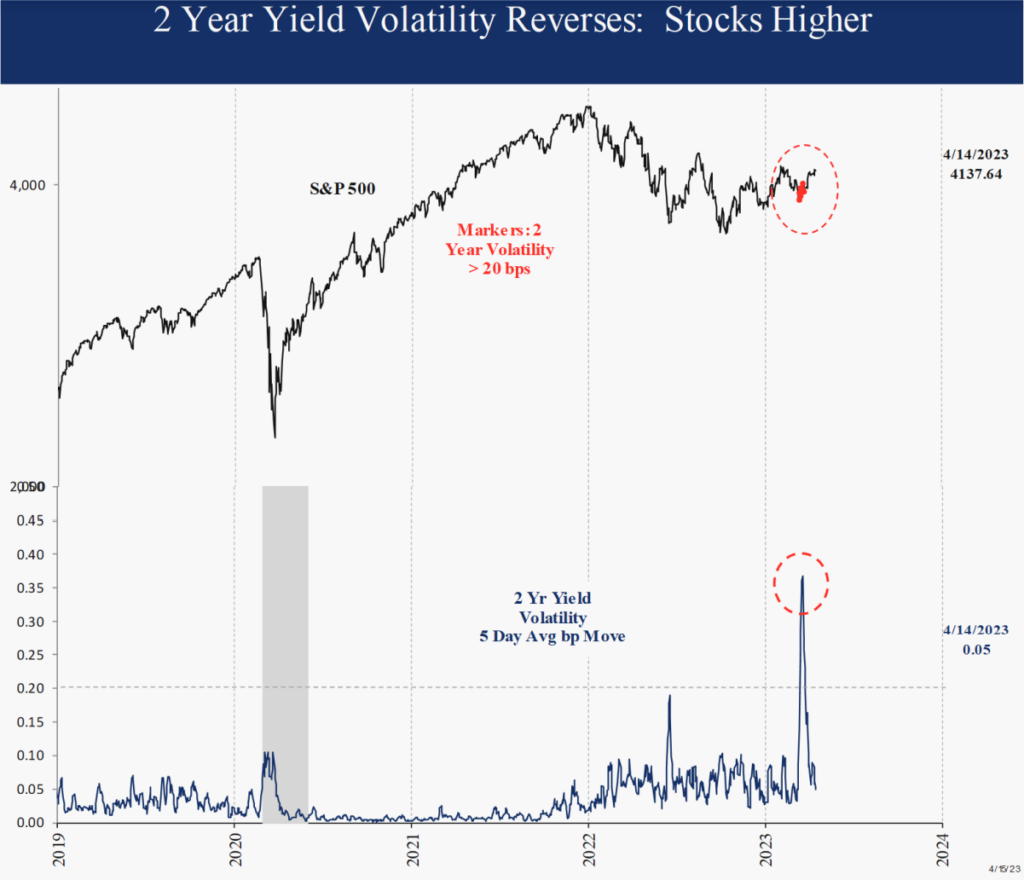
Last month we discussed bank stocks and 2‐year yield volatility which resulted in extreme equity investor positioning. The headlines were dire, but the conditions were bullish for equities. From the March 13th low, the S&P 500 rallied 8.6% through 4/14, up a surprising 7.8% YTD. This month we discuss some of the consequences, and more importantly the implications of the bank panic, the massive Fed Bank lending, the reversal in fiscal stimulus, the weak dollar, and the surprising recent upward reversal in commercial bank deposits and loans. U.S., foreign‐developed, and emerging markets equities remain bullish 5 ratings. Long‐ term bonds remain a neutral 3 rating. Gold remains a bullish 5 rating and industrial commodities remain a neutral 3 rating.
Simultaneous Fed Easing and Tightening: Easing Dominant for Now
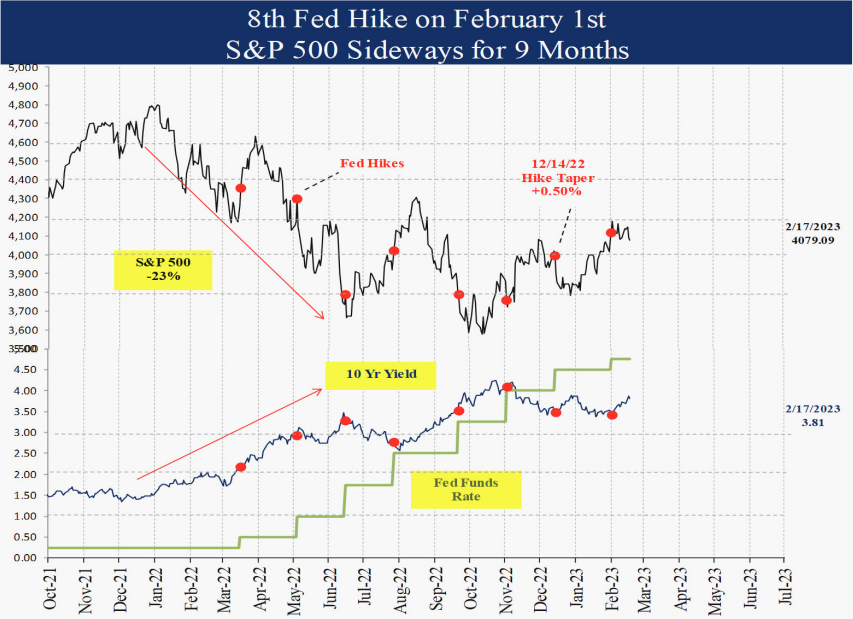
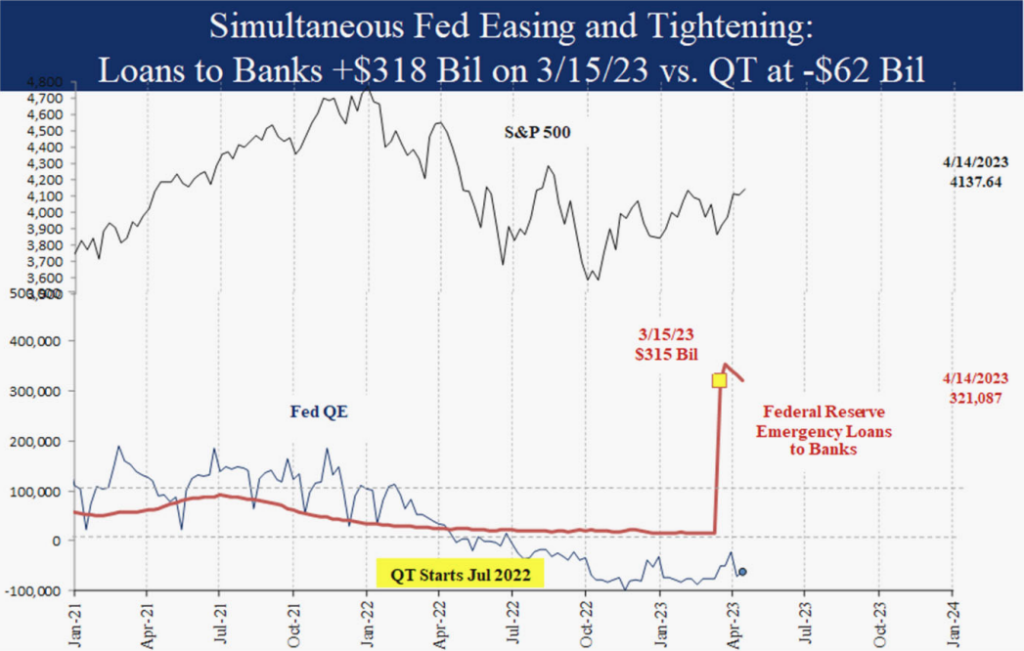
It is no secret the Fed has been fighting inflation by hiking interest rates 9 times and shrinking their balance sheet through quantitative tightening for over a year. What the Fed did in March is less well understood. To protect the banking system and restore confidence, they loaned banks $318 billion in a single week ending March 15th (details available in the H.4.1 release on the Fed website). Consider this $318 billion (1.2% of GDP) had not existed in any form a month earlier. It was a great illustration of the Fed’s awesome power to create massive liquidity out of thin air in a matter of days. On a short term basis, the direct liquidity injection was even more potent than quantitative easing, which involves an exchange of assets (Treasury Bonds for Cash payment). Even Congressional spending requires a trade off like higher taxes or borrowing to source the funds. It is no coincidence this Fed move marked the equity low on March 13th since it completely overwhelmed the tightening effects of both the Fed hiking rates and the ongoing quantitative tightening. The bullish stimulus will fade as banks pay back the emergency loans, but for now the equity market agrees that the Fed’s actions and new dollar creation speak louder than their words about 2% inflation.
Fiscal Cliff Reverses: Bullish for Economy
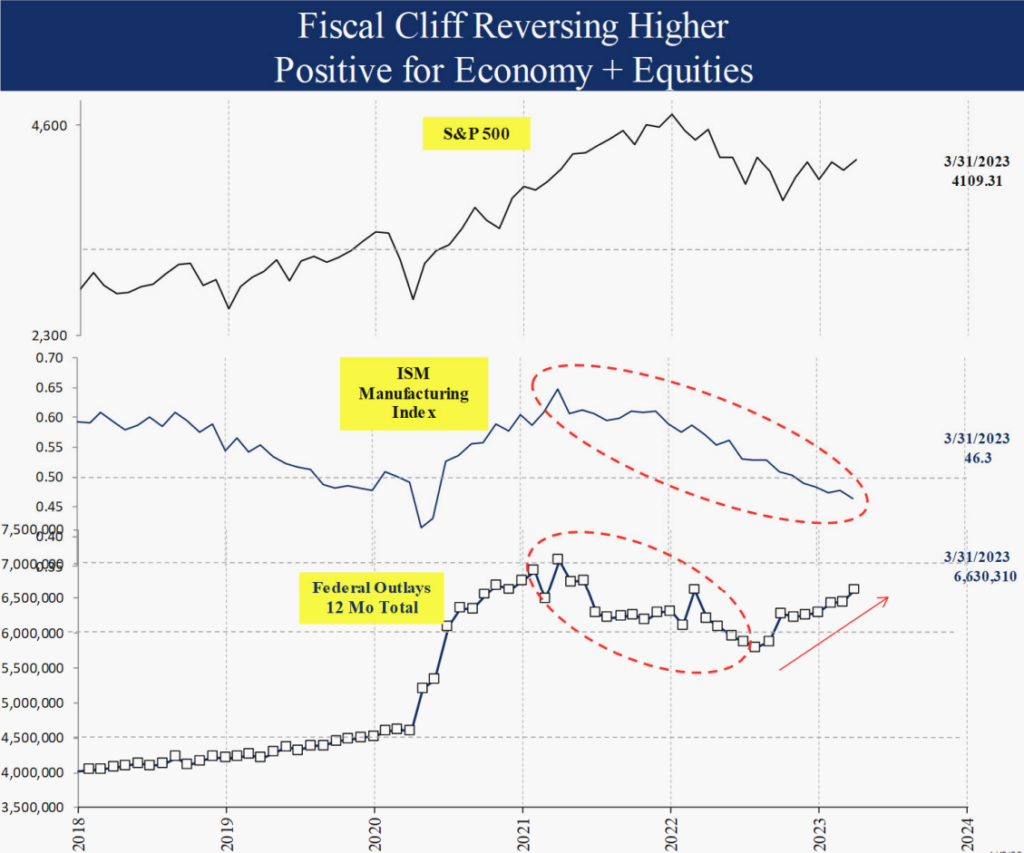
During COVID federal outlays increased dramatically from $4.5 trillion to $7.0 trillion by 2021. One of the biggest concerns from economists was the “fiscal cliff” when all this spending would inevitably reverse. Over the next year spending did normalize back to $6 trillion by 2022, and the $1 trillion cut in spending is likely one reason the economy slowed initially. The ISM Manufacturing Index declined from a peak of 65 in March 2021 to a recent 46.3 in March. However, since July there has been an $800 billion spending INCREASE from a low of $5.8 trillion to a recent $6.6 trillion in the 12 months through March. For perspective, the total of $6.6 trillion is 25.4% of GDP and the increase alone since July amounts to 3.0% of GDP. Although investors are focused on the Fed tightening policy, Federal spending is a major stimulative offset still 50% above pre Covid levels. Presumably, the debt ceiling debate will affect the spending trajectory – stay tuned. Economic outlook indicators remain neutral, but they are already higher since March.
2‐Year Yield Volatility Reverses: Positive
The March 16th spike in the 2‐Year Yield volatility seemingly marked the low in equities. Of the two prior volatility spikes, so far this year is more comparable to the bullish 1987 case than the more recent, and feared, bearish 2008 case. It has become clear there is no systemic bank risk like 2008, but instead a few banks with idiosyncratic problems caused by poor interest rate management.
Commercial Bank Loans and Deposits Reversing
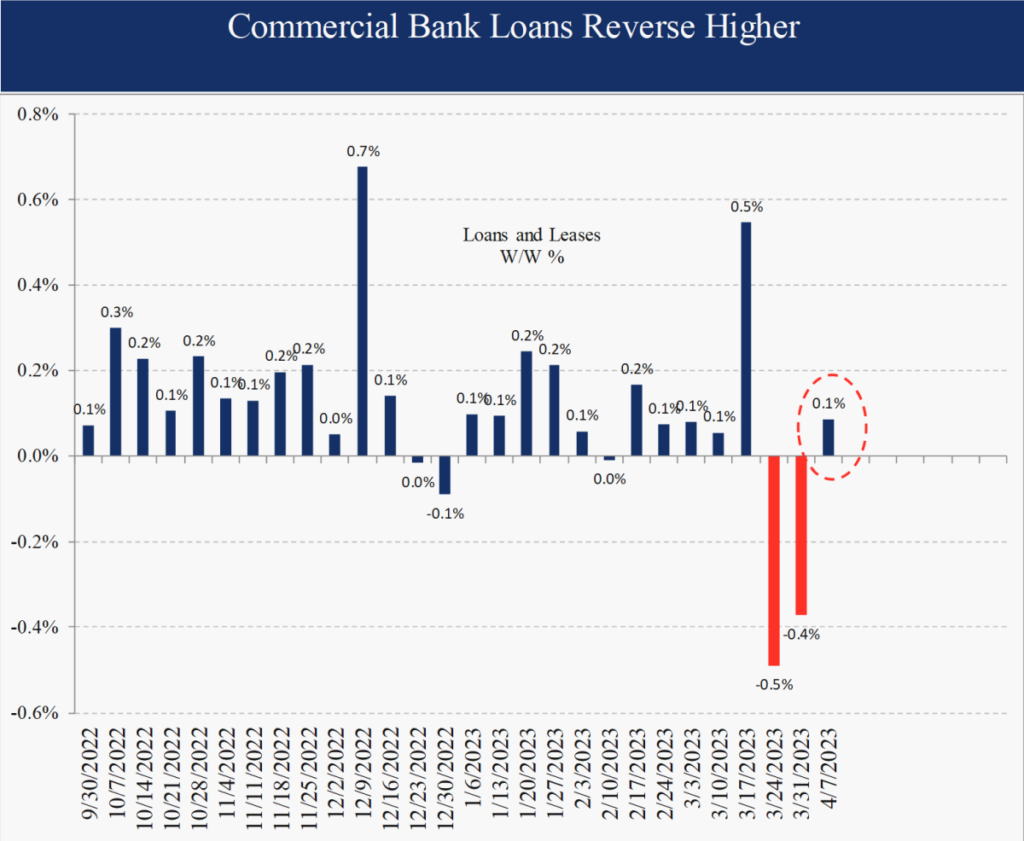
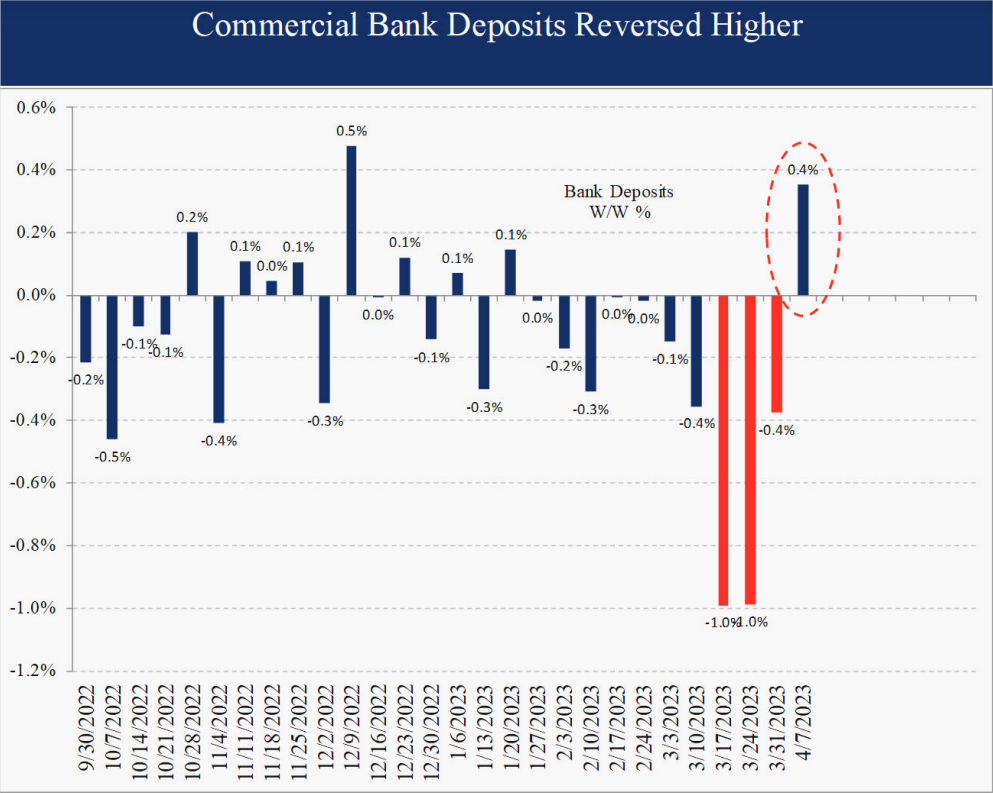
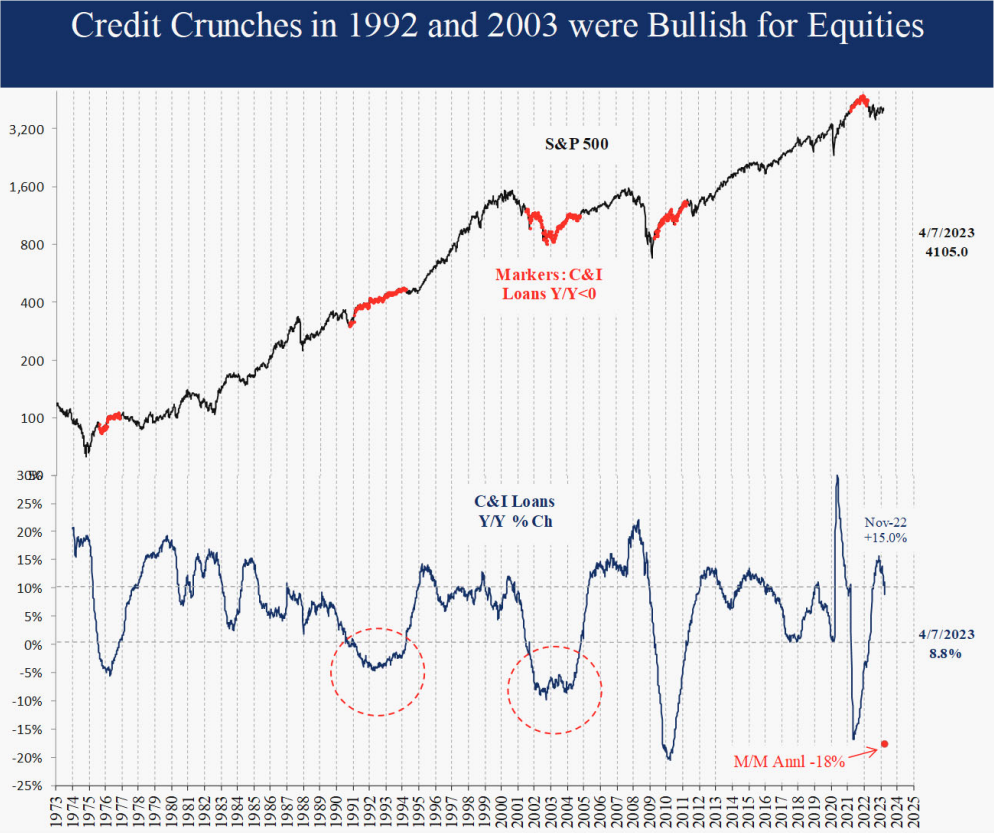
It was widely reported that commercial bank loans and deposits were down sharply after the bank failures in March. It fit the credit crunch narrative that banks will pull back on lending as their deposits shrink, further contributing to the widely expected recession ahead. However, in the latest week ended April 7th, loans and deposits reversed higher, begging the question whether this was an isolated panic. Also consider that during two prior credit crunches in 1992 and 2003 when bank loans declined Y/Y, equity prices rallied. It is not a foregone conclusion that a. there will be a credit crunch, b. whether that will cause a recession or c. that those will cause stock prices to decline.
Dollar Down: Bullish for Foreign Equities
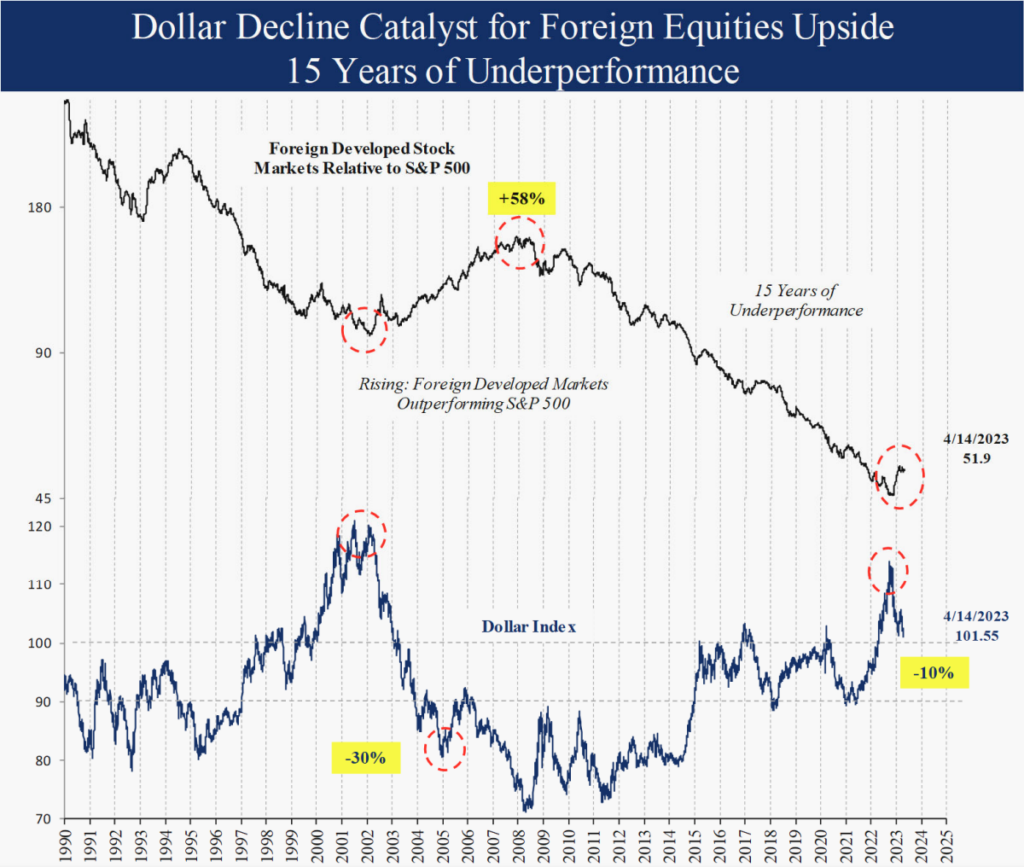
One of the biggest outcomes of the banking crisis was lower interest rates and a weaker dollar, a potential catalyst for a reversal in foreign equities. In the last 15 years, the S&P 500 Index ex‐dividends rallied 160% while the foreign developed countries index (Europe, Asia and Far East – EAFE) was actually down 13%. After this one‐sided persistent move, no wonder that most U.S. and even foreign investment portfolios are overweight U.S. equities. The last outperformance by foreign equities was 2002 to 2007 when the EAFE Index beat the S&P 500 by 60%. During that period, it was no coincidence the Dollar Index declined 30%. This year the dollar is down 10% from the October peak and foreign equities have already responded to the upside. Expectations, positioning, and valuations for foreign equities are all low, setting the stage for a sustained move to the upside as institutions reposition.
Gold Rally
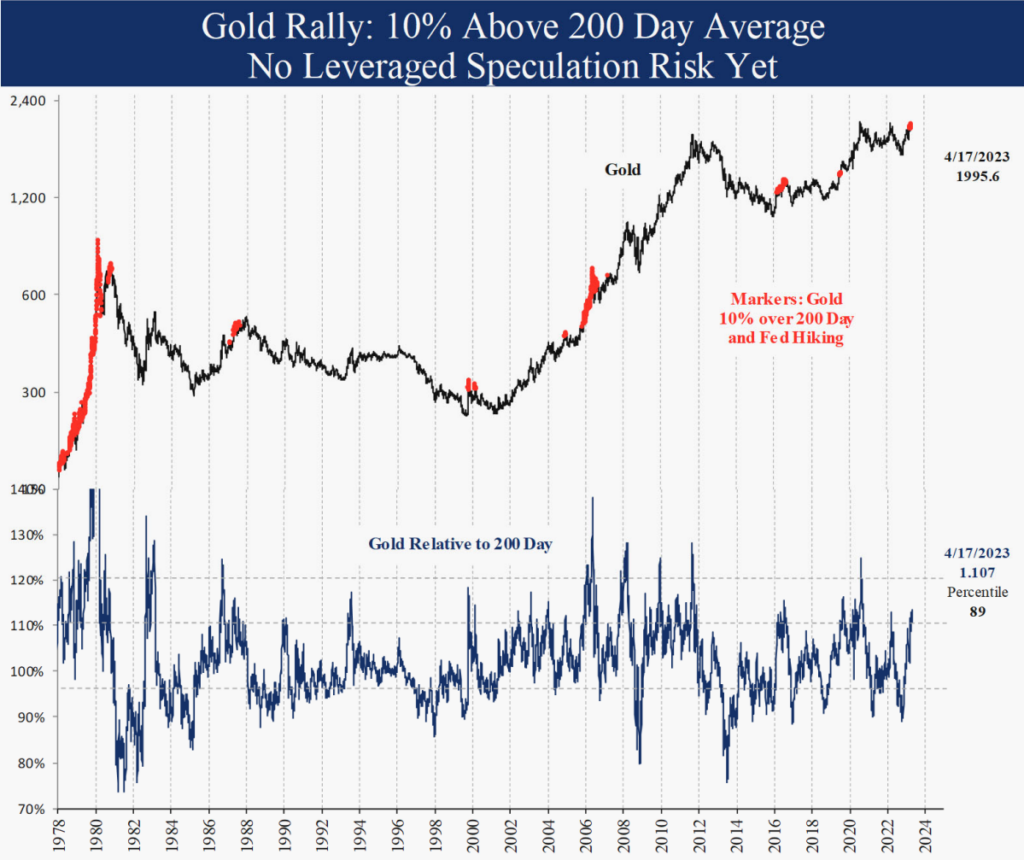
Another result of the dollar decline since October is a strong gold rally, up 23% from the October low. Gold is currently 10% over the 200‐day average, in the 89th percentile historically. This is not yet extreme enough to be concerned so long as the Dollar does not reverse higher. In prior gold rallies like 2020, 2010, 2009, 2008 and 2006, gold rallied to over 20% above the 200‐day average before reversing lower. This is usually the time when we would see signs of leveraged speculation, which would be an added risk and reason to cut back. Since 1979 gold returned 15.0% annualized when the Fed was hiking and the Dollar was falling. It is no coincidence the recent gold low in October coincided with the Dollar peak.
Inflation Still Falling Fast: Bullish for Equities
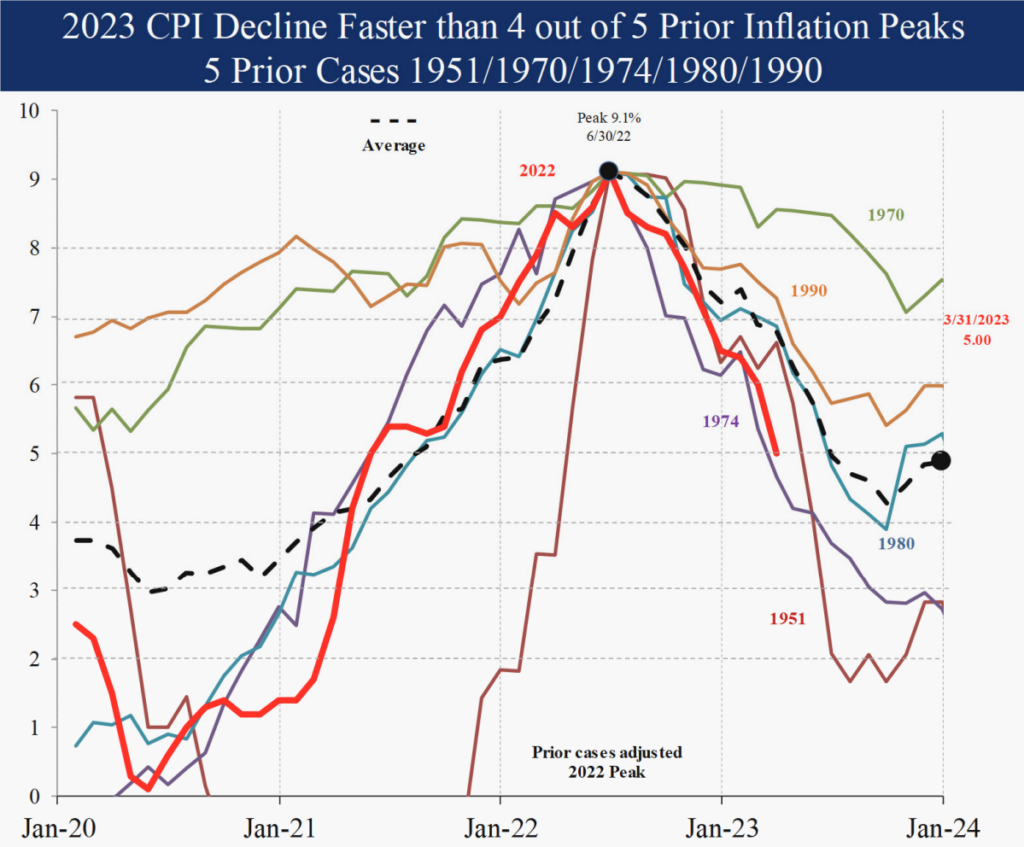
Since the June inflation peak at 9.1%, inflation reports have been met with skepticism. In fact, the 4% decline in headline CPI inflation to 5.0% in March has been faster than 4 out of 5 prior cases. Core inflation is a valuable tool since it is less volatile, but investors are confusing low volatility with the concept of a leading indicator. Our inflation outlook indicators remain in the neutral zone at 42. Energy prices are up in April, but year ago comps are high for the next 3 months which should translate into a lower headline Y/Y CPI by June. Declining inflation, even from a high level, is a powerful bullish signal for equity markets historically.
Summary
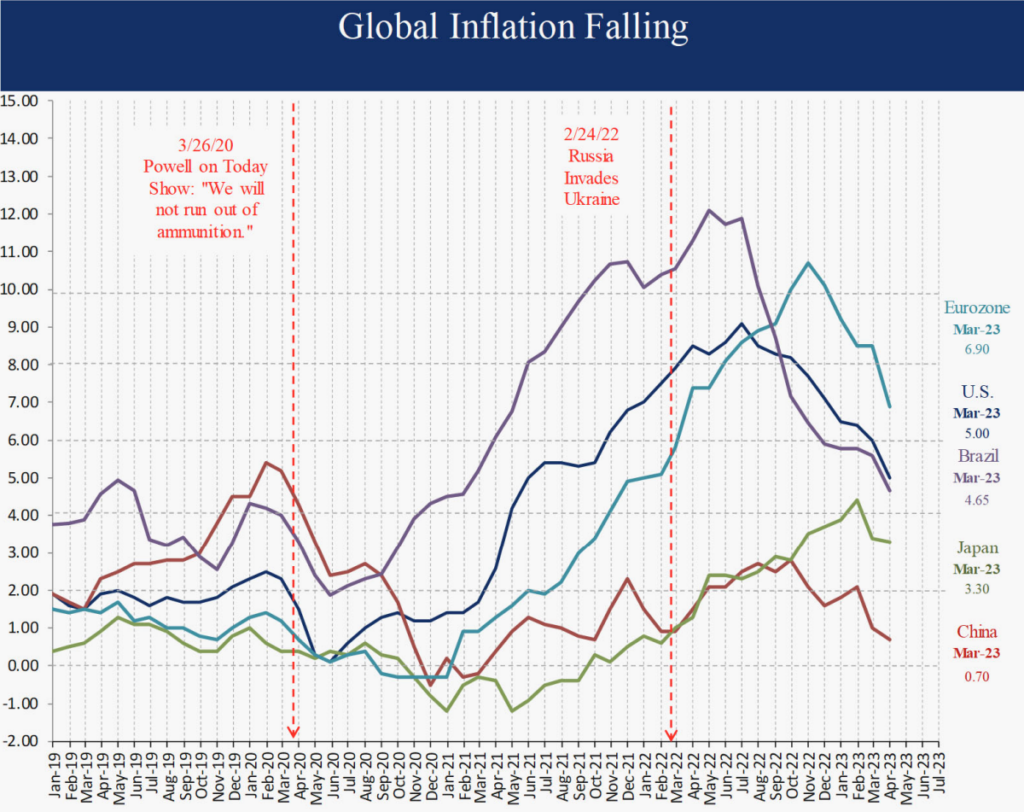
This month we discussed the simultaneous hiking and easing policy moves by the Federal Reserve, the bullish effects of the rising fiscal spending as well as the implications of the weaker dollar, including the 3‐month gold rally. Finally, the bullish effect of falling inflation cannot be overstated, with clear evidence around the world despite investor and Fed skepticism. Even after the sharp moves in bond and equity markets this month, our ratings remain unchanged. We will continue to watch our indicators on a daily basis for changes. Thank you for your support and please contact us with any questions.

Michael Schaus
Director of Market Research
Michael Schaus is the Director of Market Research for Brenton Point Wealth Advisors and Zweig-DiMenna. Since joining Zweig-DiMenna in 1992, his focus has been on macroeconomic research, the analysis of…
READ MORERead Next:
Sign up!
Sign up for our monthly newsletter and get the lastest news and research from our esteemed advisors here at Brenton point. Right into your inbox!


 Client Login

