 Client Login

Bond Fire
Investing Environment Review and Outlook – Volume 58
Bond Fire
The perfect storm of inflation, war in Europe and the Fed hiking rates continues this month. To that, we can add what I call the 2022 Bond Fire to the mix – the extraordinary move higher in Treasury yields which has so far caused an 8% decline in Barclay’s aggregate bond index and a 16% decline in long-term Treasury prices. For perspective, long-term bonds have lost over 5 times their annual yield in less than four months. We have also witnessed daily headlines of the inverted yield curve and recession predictions. This month we discuss the implications of these quickly changing economic and monetary conditions in a longer-term historical context, inflation outlook indicators, investor positioning, seasonality, and S&P 500 valuation.
In early April after an 11% rally from the low, we cut equity exposure in accounts and cut the U.S. equity rating to a bearish 1. We also cut foreign- developed equities to a 2 rating and emerging markets to a neutral 3 rating. Long term bonds remain a cautious 1, gold a bullish 5 and commodities are a neutral 3.
Treasury Yields Up: Negative for Equities
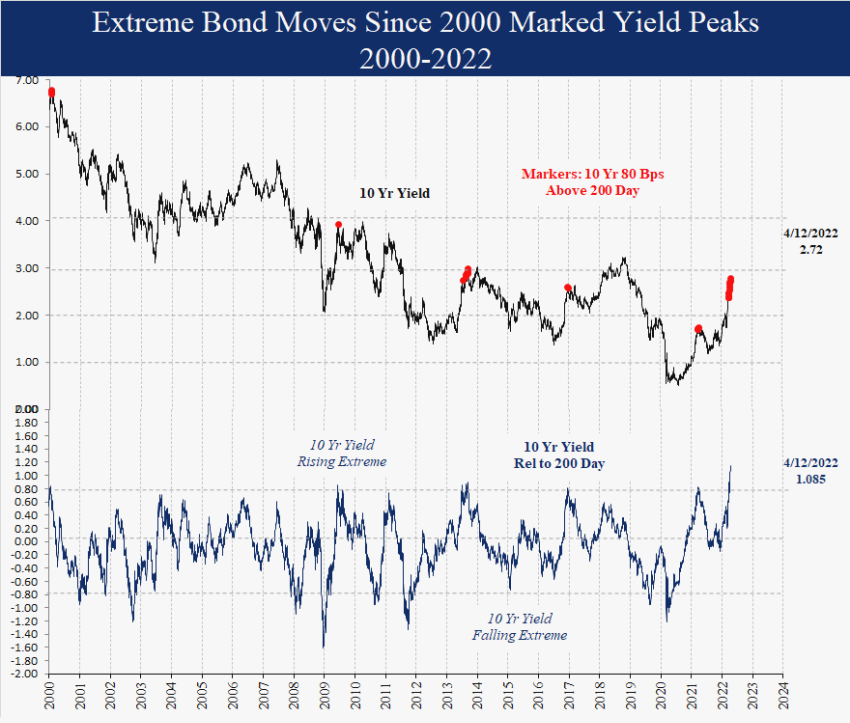
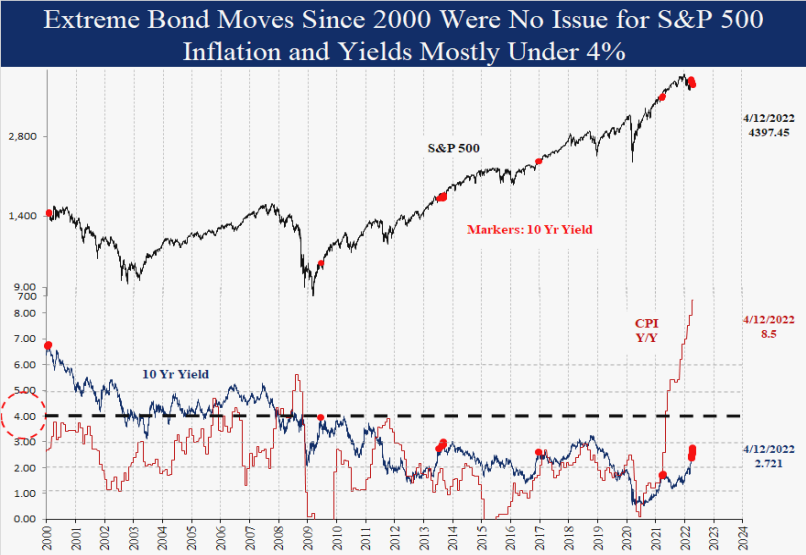
The move in the 10-year yield this year has been extraordinary, moving from 1.5% at year end to 2.8% on April 11th, as inflation rose and the Fed promised more aggressive tightening. Since 2000 extreme yield moves like this, in 2021, 2016, 2013 and 2009, marked yield peaks and consequently were no issue for equities, which continued higher as yields reversed lower. This pattern in the last 20 years has led many to expect yields to peak and equities to resume their rally. There is good reason why Powell expected inflation to reverse lower last year and why many investors expect inflation and bond yields to reverse lower today. These are the patterns they know from experience.
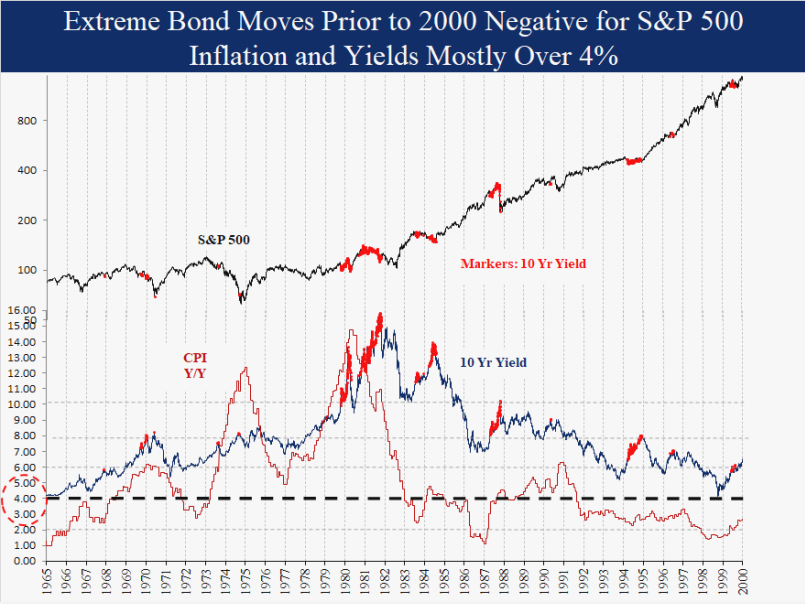
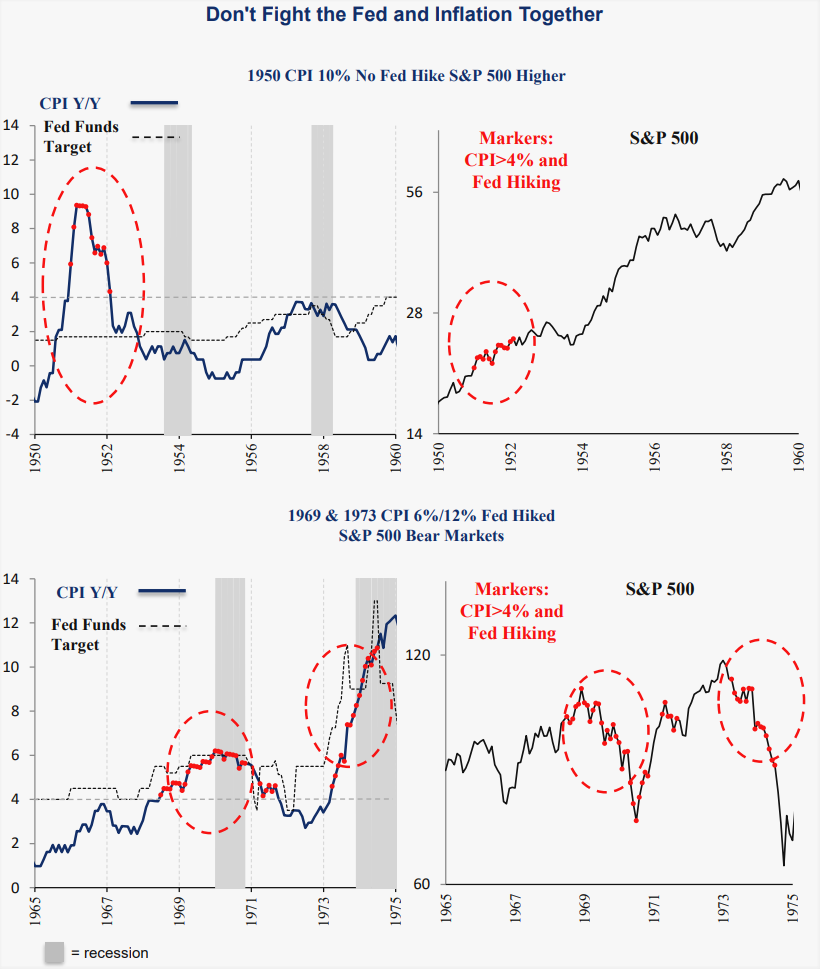
Looking further back to extreme bond yield moves prior to 2000, two things become clear. Bond yields not only tended to persist higher for longer, but these moves also led to S&P 500 bear markets in many cases (1987, 1984, 1981, 1980, 1973 and 1969). It is easy to say the world was very different then, which is true. No internet, no iPhones and a less diversified economy based more on manufacturing. However, inflation at 8.5% today makes the cases prior to 2000 more comparable. Since 2000, inflation was mostly under 4% while prior to 2000 inflation was mostly over 4%. Inflation, combined with the Fed hiking rates, was negative for stocks historically because the Fed has no option to pause or even reverse and cut rates until inflation reverses.
Consider the widely cited 1994 case. The Greenspan Fed hiked the Fed Funds target aggressively from 3% to 6% and the 10-year yield also rose with short rates. After an initial 9% decline in March, the S&P 500 ended flat on the year, up 1.3%, then rallied higher the next 3 years. However, the key difference that year was an absence of inflation. CPI ended the year at 2.7%, exactly where it started. One reason equities rose in 1995 was because rates were 300 bps over inflation, allowing equities to rally as rates unwound to the downside.
Today is the opposite with negative implications for equities. The Fed Funds target is 800 bps BELOW the inflation rate, and consequently unlike 1994, the Fed does not have the option to pause or cut rates. Historically, equity prices declined with this combination, anticipating further interest rate increases ahead.
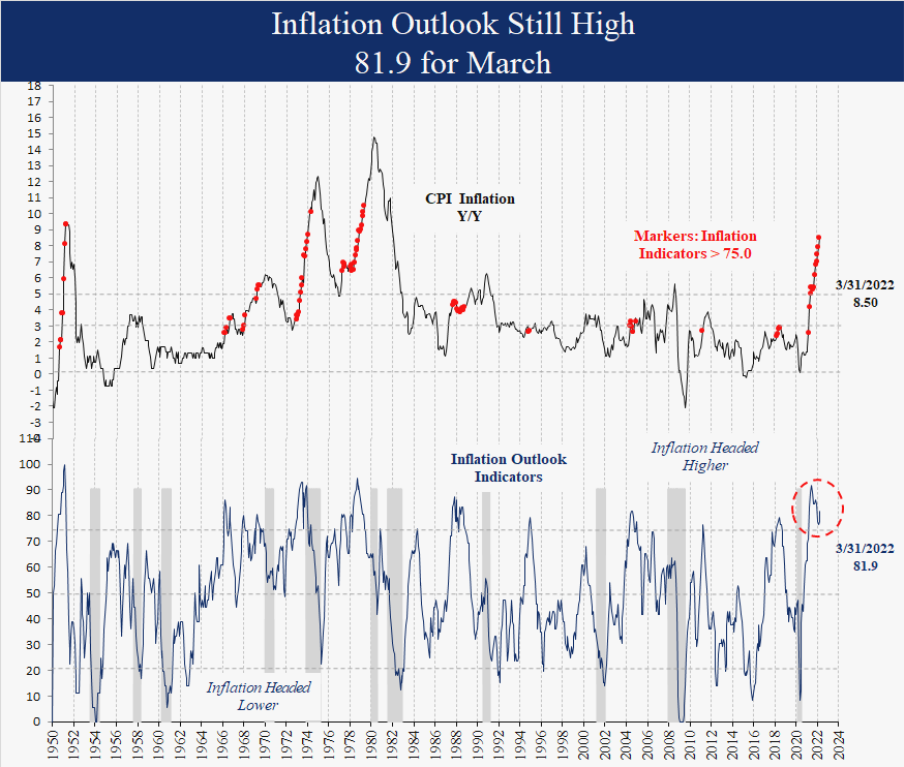
Inflation Outlook 81.9: Still High
The inflation outlook upticked in March to 81.9. Inflation pressure remains despite the consensus expecting March as the peak for the year. We will be watching these indicators closely for a reversal, since lower inflation would be extremely significant for the investment environment. For now the high readings mean no relief in sight although the lower ISM index and higher CPI comps in the months ahead will help. For a lower CPI reading by year end, the M/M readings must drop below 0.6% vs. recent readings 1.2% in March and 0.8% in February.
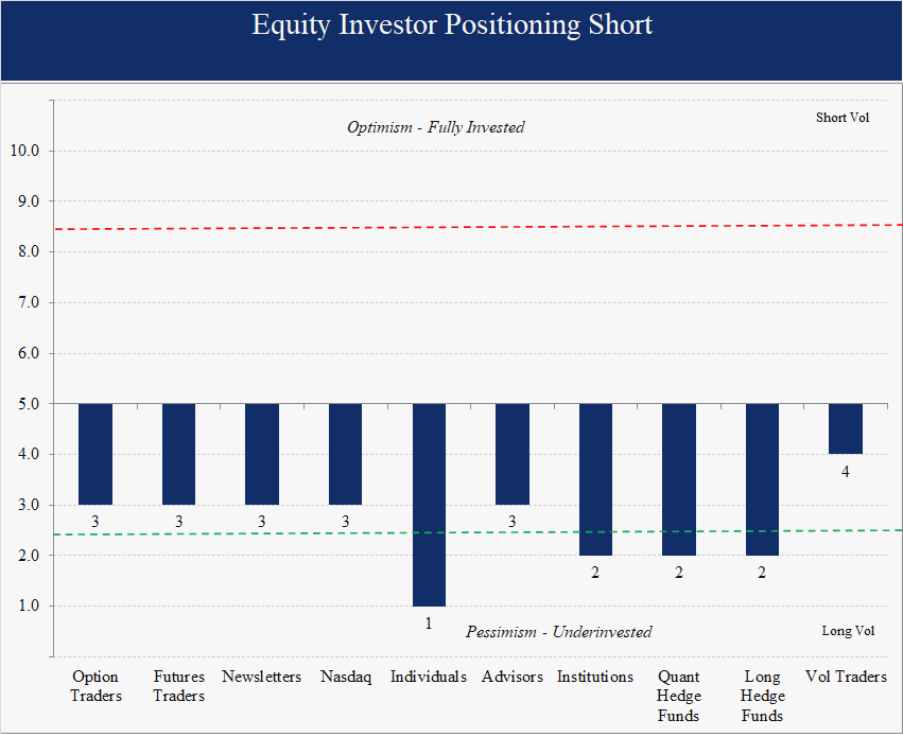
Equity Investors Short
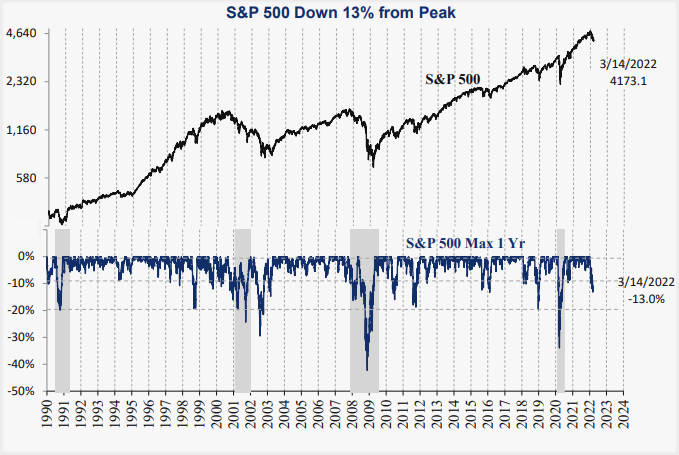
All ten equity investor groups we follow are negative on equities, suggesting excess short-term cash on the sidelines and a potential rally ahead at some point. Positioning is still not as extreme as the March 8th low when the S&P 500 was down 13% from the peak.
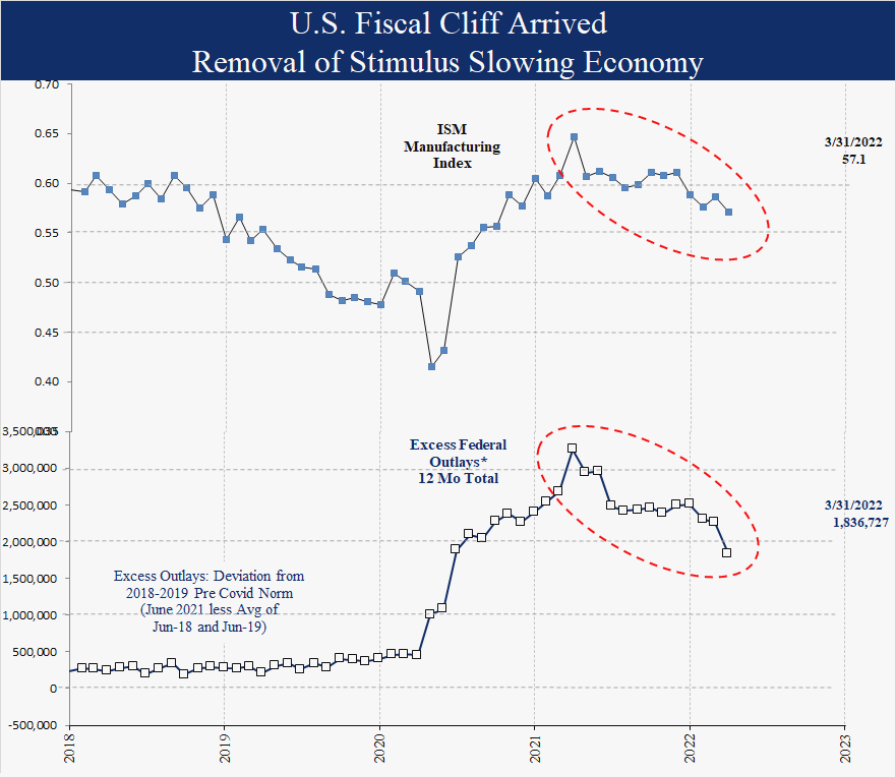
Fiscal Cliff Arrived: Economy Slowing
The much-anticipated reversal in federal expenditures, also known as the fiscal cliff, finally arrived this year. After surging to over $3 trillion, excess federal outlays are down over a trillion to under $2 trillion as of March 31. Excess outlays are defined as the excess over the 2018-2019 norm. The high correlation to the economy demonstrates how important this fiscal impulse can be when this extreme. With fiscal programs deadlocked in Washington, D.C., the economy has already slowed on its own with minimal Fed input. Our economic outlook indicators remain neutral and a recession in the next 12 months remains a low probability for now.
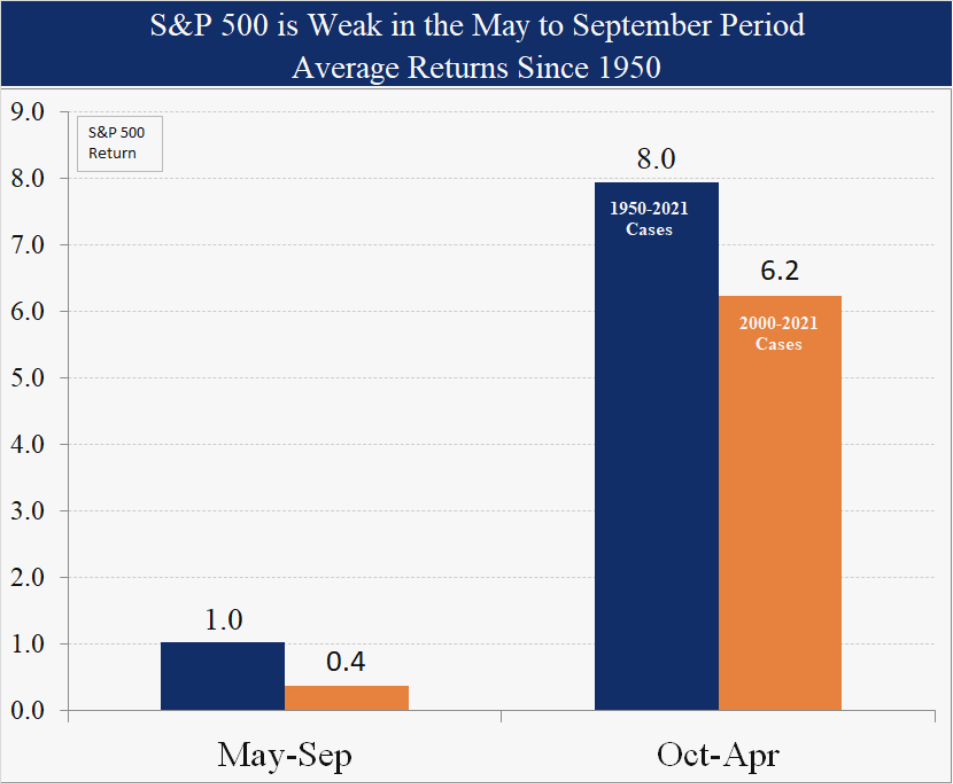
S&P 500 is Weak in the May to September Period
May 1st begins the weakest seasonal period of the year through September. Since 1950 the S&P 500 averaged just 1.0% during these 5 months vs. 8.0% for the 7 months between October and April. Despite the well-known saying “sell in May,” the pattern has persisted consistently since 1950 and holds more recently as well. Since 2000 the May to September period was up 68% of the time vs. 81% for the October to April period. It is one more reason to be cautious on equities.
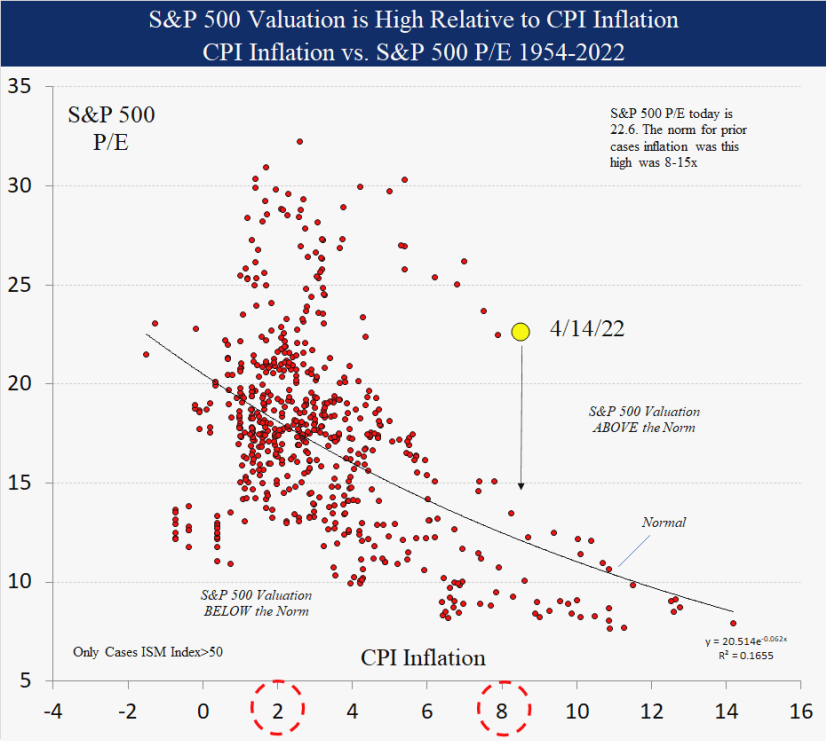
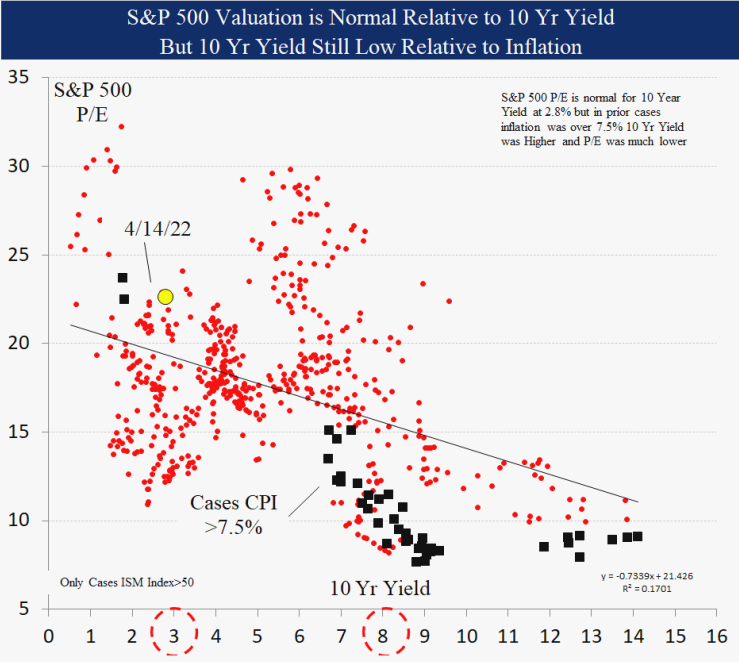
S&P 500 Valuation is High Relative to CPI Inflation
Today CPI inflation is 8.5% and the S&P 500 price earnings ratio is 22.6x. Historically, when inflation was at 8%, price/earnings ratios ranged from 8 -15, 50% lower. The 10-year Treasury yield relationship to valuation is not as tight, but at 2.8%, the current P/E of 22.6 is in the normal historical range. However, in prior cases the CPI was over 7.5%, the 10-year yield was much higher above 6% and the S&P 500 P/E was also much lower in the same 8-15 range. The risk for equity markets is a consensus expecting lower inflation. If instead inflation holds or surprises to the upside, the 10-year yield may continue higher and equity valuations may adjust to the downside. Historical P/Es are a very rough guide since the composition of the index has changed dramatically towards more growth stocks with higher valuations. For this study only cases when the ISM was over 50 were used to omit recession earnings which distort the P/E ratio.
Summary
In early April after an 11% rally off the March low, we cut equity exposure in accounts and all our equity ratings. The combination of high and rising inflation, the Fed hiking rates and a rising 10-year yield is negative for equities historically, with a good possibility that a bear market began in January. The upcoming negative seasonal period combined with the valuation divergences are added risks particularly for U.S. equities. In this environment we have reduced risk to preserve capital until conditions improve. Gold remains a better option than cash to maintain purchasing power. We are testing conditions on a daily basis for any significant changes to our outlook. Thank you for your support and please contact us with any questions.
IMPORTANT DISCLOSURES
This review and outlook report (this “Report”) is for informational, illustration and discussion purposes only and is not intended to be, nor should it be construed as, financial, legal, tax or investment advice, of Brenton Point Wealth Advisors LLC or any of its affiliates (“Brenton Point”). This Report does not take into account the investment objectives, financial situation, restrictions, particular needs or financial, legal or tax situation of any particular person and should not be viewed as addressing any recipient’s particular investment needs. Recipients should consider the information contained in this Report as only a single factor in making an investment decision and should not rely solely on investment recommendations contained herein, if any, as a substitution for the exercise of independent judgment of the merits and risks of investments.
This material is based upon information obtained from various sources that Brenton Point believes to be reliable, but Brenton Point makes no representation or warranty with respect to the accuracy or completeness of such information. Views expressed herein are current only as of the date indicated and are subject to change without notice.
This Report contains certain forward looking statements opinions, estimates, projections, assessments and other views (collectively “Statements”). These Statements are subject to a number of assumptions, risks and uncertainties which may cause actual results, performance or achievements to be materially different from future results, performance or achievements expressed or implied by these forward looking statements and projections. Brenton Point makes no representations as to the reasonableness of such assumptions or the likelihood that such assumptions will coincide with actual events and this information should not be relied upon for that purpose. Changes in such assumptions could produce materially different results. Past performance is not a guarantee or indication of future results, and no representation or warranty, express or implied, is made regarding future performance of any financial instrument mentioned in this Report.
Any benchmark shown herein is shown for illustrative purposes only. No index benchmark is available for direct investment. It may not be possible to replicate the returns of any index, as the index may not include any trading commissions and costs or fees, may assume the reinvestment of income, and may have investment objectives, use trading strategies, or have other materials characteristics, such as credit exposure or volatility, that do not make it suitable for a particular person. This is not an offer or solicitation for the purchase or sale of any security, investment, or other product and should not be construed as such. References to specific financial instruments and to certain indices are for illustrative purposes only and provided for the purpose of making general market data available as a point of reference only; they are not intended to be, and should not be interpreted as recommendations to purchase or sell such securities. Investing in securities and other financial products entails certain risks, including the possible loss of the entire principal amount invested, as the value of investment can go down as well as up. You should obtain advice from your tax, financial, legal, and other advisors and only make investment decisions on the basis of your own objectives, experience, and resources.
Brenton Point accepts no liability for any loss (whether direct, indirect or consequential) occasioned to any person acting or refraining from action as a result of any material contained in or derived from this Report, except to the extent (but only to the extent) that such liability may not be waived, modified or limited under applicable law.
This Report may provide addresses of, or contain hyperlinks to, Internet websites. Brenton Point has not reviewed the linked Internet website of any third party and takes no responsibility for the contents thereof. Each such address or hyperlink is provided solely for your convenience and information, and the content of linked third party websites is not in any way incorporated herein. Recipients who choose to access such third-party websites or follow such hyperlinks do so at their own risk.
All marks referenced herein are the property of their respective owners. This Report is licensed for non-commercial use only, and may not be reproduced, distributed, forwarded, posted, published, transmitted, uploaded or otherwise made available to others for commercial purposes, including to individuals within an institution, without written authorization from Brenton Point.
Source of data and performance statistics: Bloomberg L.P. and Factset Research Systems Inc.
©Brenton Point Wealth Advisors LLC 2022

Michael Schaus
Director of Market Research
Michael Schaus is the Director of Market Research for Brenton Point Wealth Advisors and Zweig-DiMenna. Since joining Zweig-DiMenna in 1992, his focus has been on macroeconomic research, the analysis of…
READ MORERead Next:
Sign up!
Sign up for our monthly newsletter and get the lastest news and research from our esteemed advisors here at Brenton point. Right into your inbox!