 Client Login

Boom Phase Extremes
Investing Environment Review and Outlook – Volume 47
Boom Phase Extremes
Last month we discussed the arrival of the boom phase of the economic cycle, when the economy is extremely strong, industrial commodities like copper and crude oil rally, long-term interest rates rise, and overall confidence surges. Since then, we saw further confirmation from the ISM manufacturing index release on April 1st reaching the 96th percentile, the 800,000 March jobs number, and the surprising rebound in consumer confidence to 109.7. Usually at this point in the cycle the Fed would be hiking rates to head off potential inflation, at least to a neutral zone. But this time really is different as the Fed is not only holding rates at zero, but stating they want higher inflation. This month we discuss two extremes and the investment implications of the inflation outlook and investor positioning. Our U.S. equity rating remains a bullish 4. Foreign developed and emerging market equities remain a bullish 5, along with gold and commodities. Long-term bonds remain a cautious 1.
Inflation Outlook Indicators Extreme
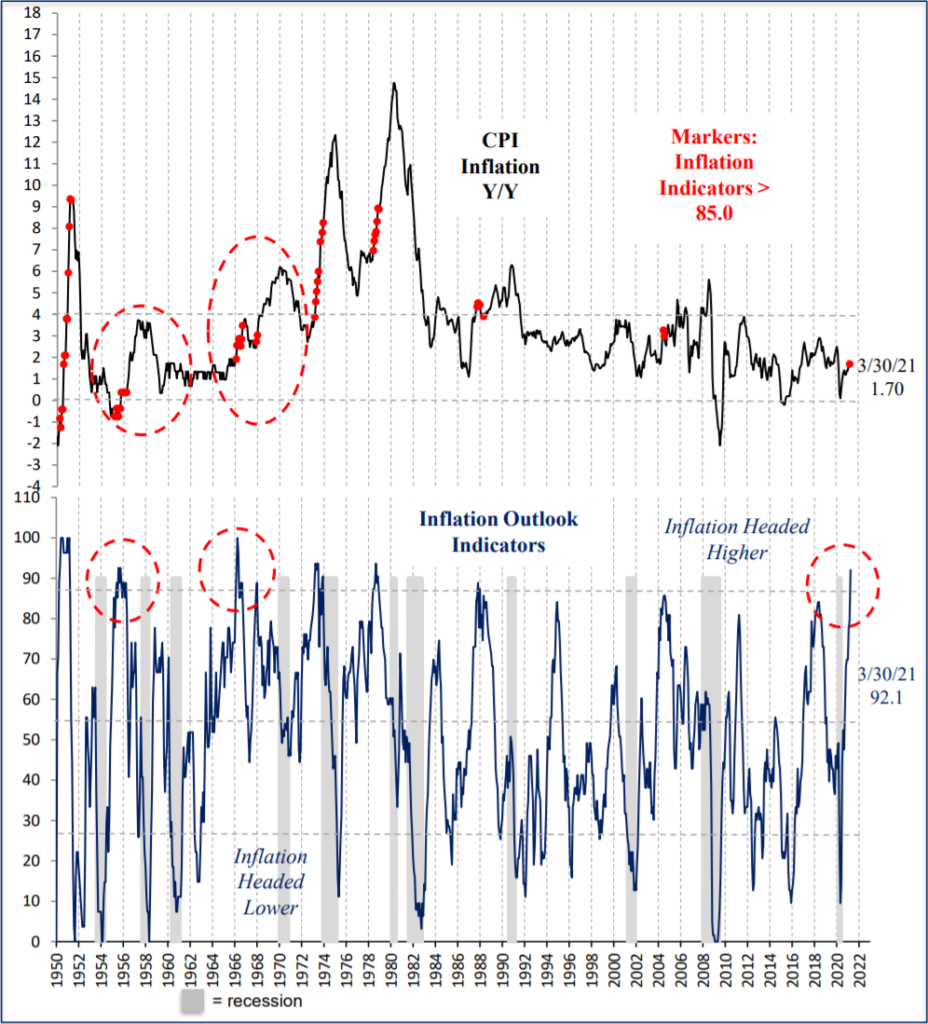
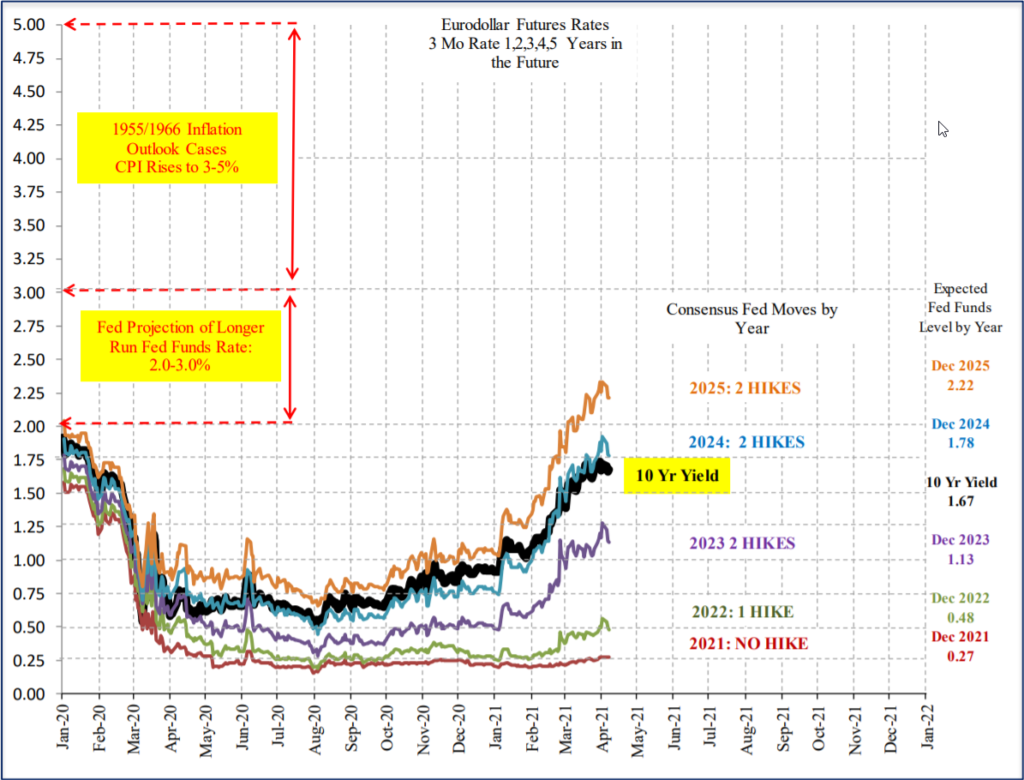
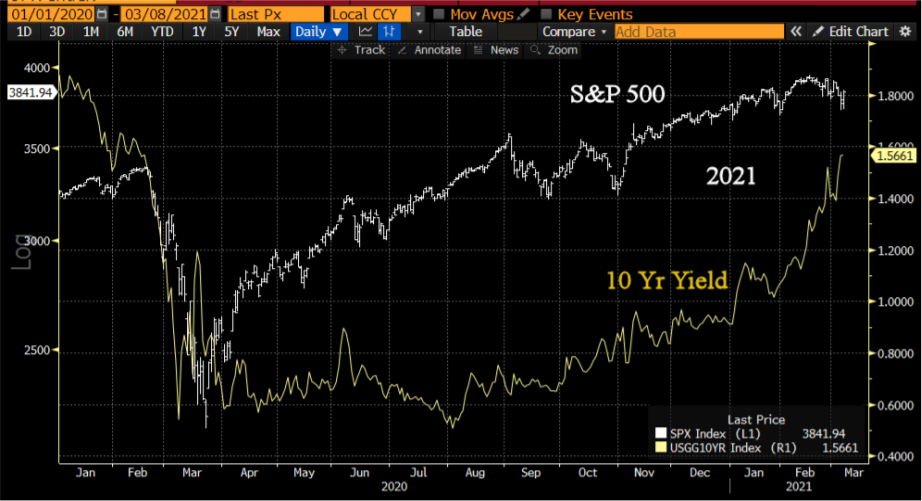
Inflation outlook indicators reached an extreme in March at 92.1, the highest since 1978. Components include stronger PMI readings for the economy as well as prices paid, stronger consumer confidence and a weak dollar. After the 7 prior cases since 1950, inflation rose in every case, but 1955 and 1966 are probably the best comparable cases, when inflation rose to the 3-5% range. Higher inflation is a consensus view with investors and Fed Chairman Powell, although most side with Powell that it will be a temporary surge as fiscal stimulus fades by year end. What we do know is that CPI will be 3.5% Y/Y or more by May due to the weak readings a year ago. The green line in the 2nd chart shows the market now expects one hike during 2022 up from none in January. The top line shows consensus expects Fed Funds at 2.2% by the end of 2025. The black line shows how the 10-year Treasury yield rose this year with expectations of Fed actions. Historically the Fed hiked Fed Funds above the inflation rate during tightening cycles when they were trying to slow inflation. With the inflation outlook model so strong, inflation will likely break above 3%, and the 10-year yield with it. This is an immediate risk to long-term bond prices since prices decline as rates rise. Once the Fed decides that rising inflation is an issue and starts hiking rates, that will be a new risk for the economy and equities.
Inflation Outlook Extreme: Higher Inflation Ahead
10-Year Rises with Expectations for Fed Action: 3%-5% Plausible
Investor Positioning Extreme: Muted Returns Ahead
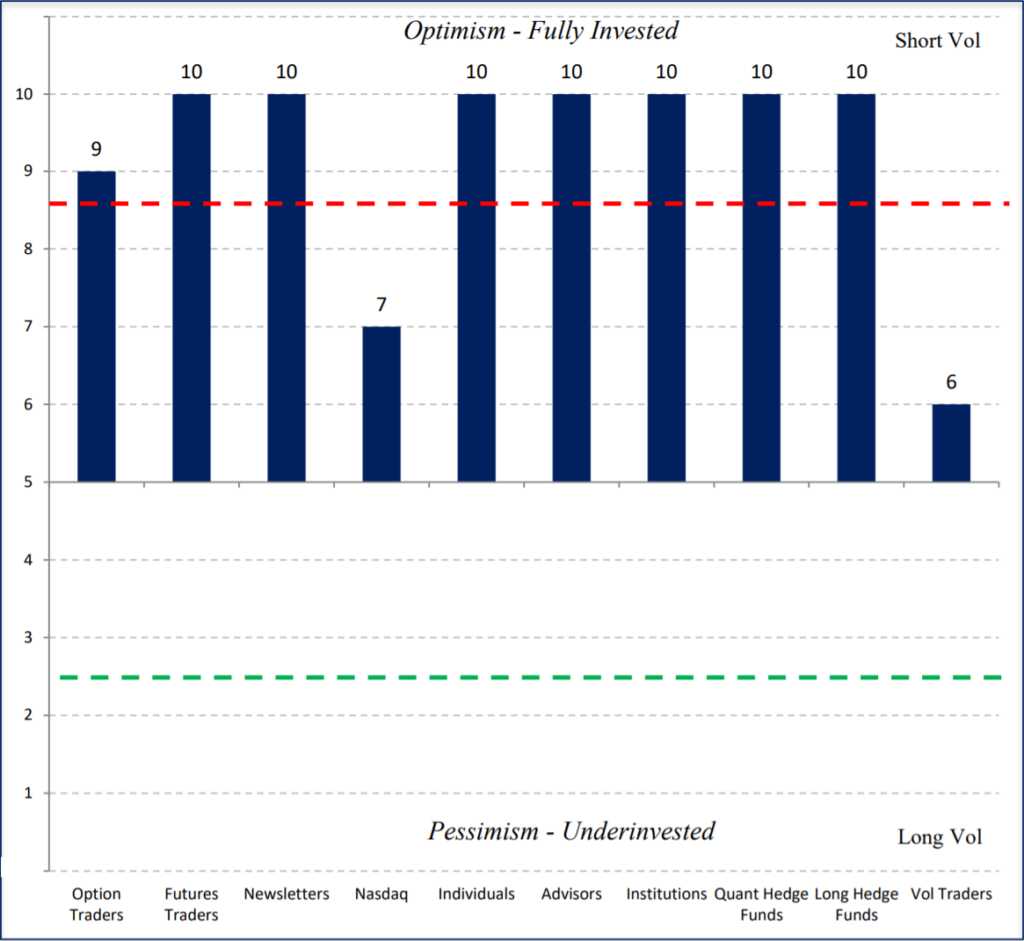
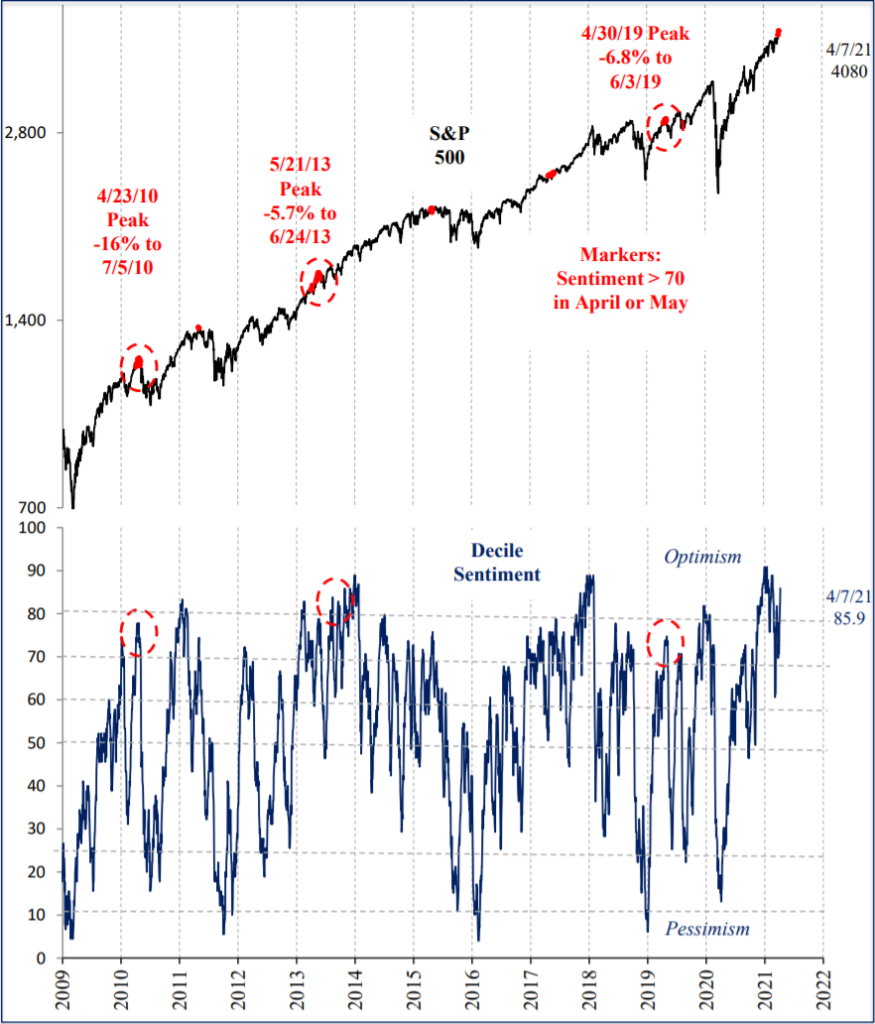
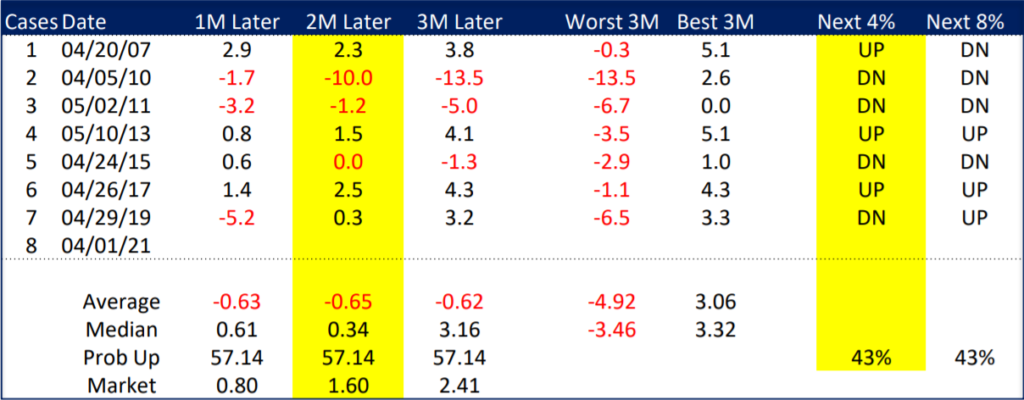
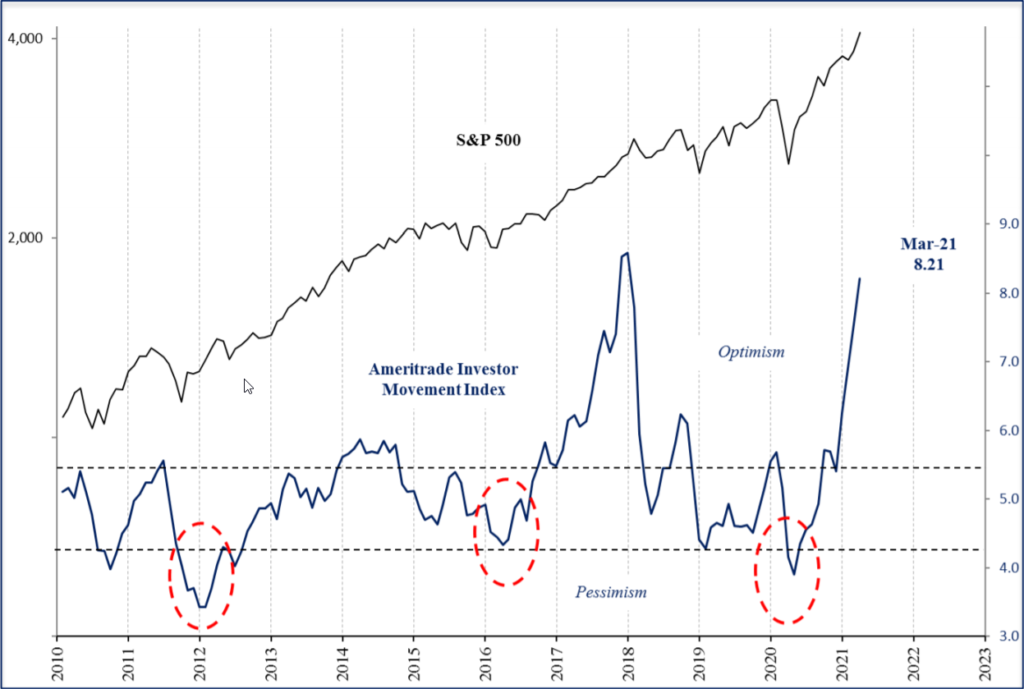
After largely positive headlines from vaccines, dropping COVID cases, passage of the stimulus bill and a 9% S&P 500 rally in a month, investor positioning reached an extreme on April 8th, with 8 of 10 investor groups now in the top quintile historically. Investors added equity exposure during the rally as usual, leaving less cash available for future purchases. Last year we noted extreme positioning in the fourth quarter was not significant for markets. However, in prior cases in April or May, extremes like this were more negative for forward returns in the S&P 500. No disasters followed, but returns were flat 2-3 months out and the next 4% and 8% moves were up 3 times and down 4 times. Investor sentiment is not the most effective indicator, but it is an important check on our emotions, which do their best to cloud our rational thinking. The third chart shows extreme optimism by individual investors in the Ameritrade Investor Movement Index.
Equity Investor Positioning Extreme 8 of 10 Groups Extreme
Investor Positioning Back to Extreme: 3 Comps in April/May followed by 6-15% Declines
S&P 500 Returns after Positioning Extreme in April or May Mixed Returns 2-3 Months Out
Ameritrade Investor Movement Extreme
U.S. Economic Strength 96th Percentile: Boom Phase of Cycle Confirmed
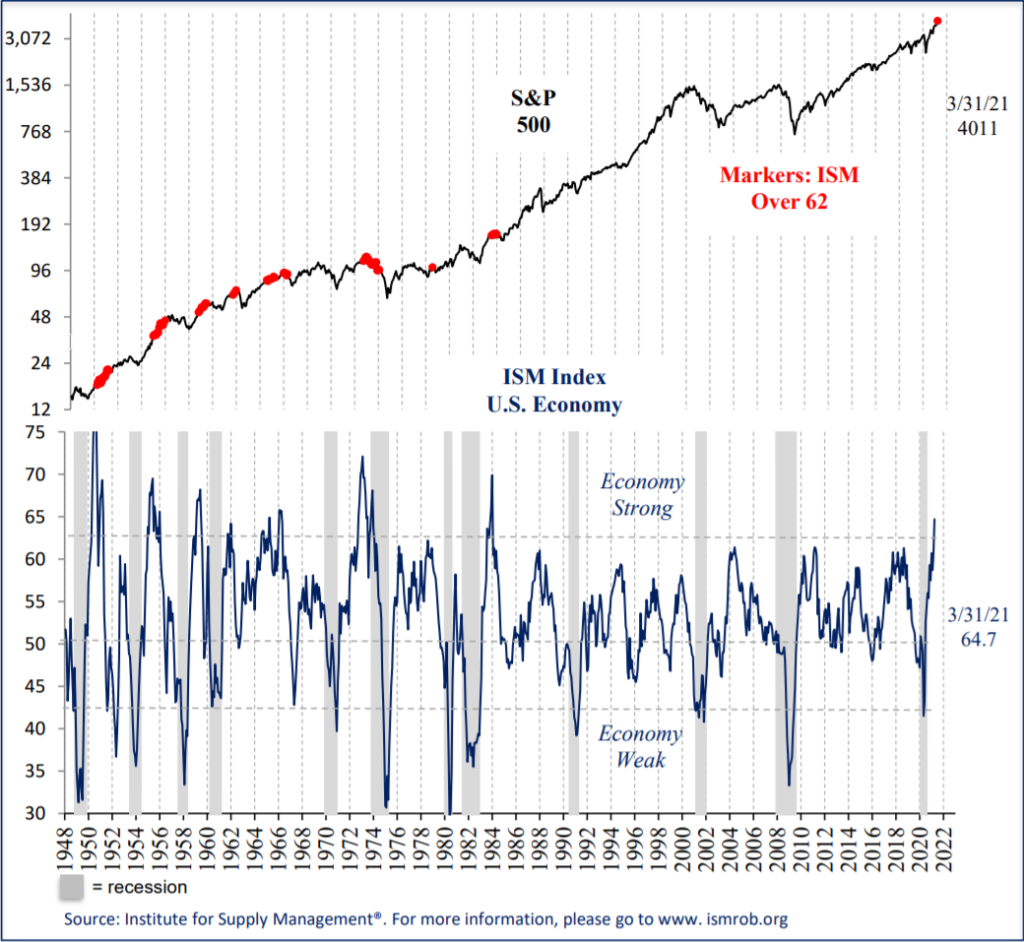
The ISM Manufacturing Index for March was widely reported at 64.7, the highest since 1983, and the 96th percentile of readings since 1948. It confirmed the U.S. is indeed firmly in the boom phase of the economic cycle. The most “recent” cases in 1983, 1973 and 1966 were negative for equities but were accompanied by Fed hiking rates, very different monetary conditions from today. Fed Chair Powell stated that he wanted to run the economy hot, and he was not kidding. A strong economy and economic outlook combined with a loose Fed is a potent and bullish combination for equities, with an 18% annualized return historically. This is particularly true while inflation remains below 4%.
ISM Manufacturing Index 64.7 in March 96th Percentile since 1948 (100th since 1990)
Summary
It is incredible to reflect how different the investment landscape is today compared to one year ago. From the depths of recession and dismal investor sentiment, conditions have completely reversed to extreme economic strength and near universal optimism. Although the 2020 COVID induced crash was one of a kind, so far, the economic and market recovery have been very typical of prior cycles. While our indicators gave us confidence in the strong economic outlook since last June, based on prior cycles we have the same conviction for higher inflation and higher interest rates today. Since no two cycles are exactly the same, we will continue watching our indicators on a daily basis for any significant changes. Thank you for your trust, and please contact your advisor with any questions.
IMPORTANT DISCLOSURES
This review and outlook report (this “Report”) is for informational, illustration and discussion purposes only and is not intended to be, nor should it be construed as, financial, legal, tax or investment advice, of Brenton Point Wealth Advisors LLC or any of its affiliates (“Brenton Point”). This Report does not take into account the investment objectives, financial situation, restrictions, particular needs or financial, legal or tax situation of any particular person and should not be viewed as addressing any recipient’s particular investment needs. Recipients should consider the information contained in this Report as only a single factor in making an investment decision and should not rely solely on investment recommendations contained herein, if any, as a substitution for the exercise of independent judgment of the merits and risks of investments.
This material is based upon information obtained from various sources that Brenton Point believes to be reliable, but Brenton Point makes no representation or warranty with respect to the accuracy or completeness of such information. Views expressed herein are current only as of the date indicated and are subject to change without notice.
This Report contains certain forward looking statements opinions, estimates, projections, assessments and other views (collectively “Statements”). These Statements are subject to a number of assumptions, risks and uncertainties which may cause actual results, performance or achievements to be materially different from future results, performance or achievements expressed or implied by these forward looking statements and projections. Brenton Point makes no representations as to the reasonableness of such assumptions or the likelihood that such assumptions will coincide with actual events and this information should not be relied upon for that purpose. Changes in such assumptions could produce materially different results. Past performance is not a guarantee or indication of future results, and no representation or warranty, express or implied, is made regarding future performance of any financial instrument mentioned in this Report.
Any benchmark shown herein is shown for illustrative purposes only. No index benchmark is available for direct investment. It may not be possible to replicate the returns of any index, as the index may not include any trading commissions and costs or fees, may assume the reinvestment of income, and may have investment objectives, use trading strategies, or have other materials characteristics, such as credit exposure or volatility, that do not make it suitable for a particular person. This is not an offer or solicitation for the purchase or sale of any security, investment, or other product and should not be construed as such. References to specific financial instruments and to certain indices are for illustrative purposes only and provided for the purpose of making general market data available as a point of reference only; they are not intended to be, and should not be interpreted as recommendations to purchase or sell such securities. Investing in securities and other financial products entails certain risks, including the possible loss of the entire principal amount invested, as the value of investment can go down as well as up. You should obtain advice from your tax, financial, legal, and other advisors and only make investment decisions on the basis of your own objectives, experience, and resources.
Brenton Point accepts no liability for any loss (whether direct, indirect or consequential) occasioned to any person acting or refraining from action as a result of any material contained in or derived from this Report, except to the extent (but only to the extent) that such liability may not be waived, modified or limited under applicable law.
This Report may provide addresses of, or contain hyperlinks to, Internet websites. Brenton Point has not reviewed the linked Internet website of any third party and takes no responsibility for the contents thereof. Each such address or hyperlink is provided solely for your convenience and information, and the content of linked third party websites is not in any way incorporated herein. Recipients who choose to access such third-party websites or follow such hyperlinks do so at their own risk.
All marks referenced herein are the property of their respective owners. This Report is licensed for non-commercial use only, and may not be reproduced, distributed, forwarded, posted, published, transmitted, uploaded or otherwise made available to others for commercial purposes, including to individuals within an institution, without written authorization from Brenton Point.
Source of data and performance statistics: Bloomberg L.P. and Factset Research Systems Inc.
©Brenton Point Wealth Advisors LLC 2021

Michael Schaus
Director of Market Research
Michael Schaus is the Director of Market Research for Brenton Point Wealth Advisors and Zweig-DiMenna. Since joining Zweig-DiMenna in 1992, his focus has been on macroeconomic research, the analysis of…
READ MORE
Sign up!
Sign up for our monthly newsletter and get the lastest news and research from our esteemed advisors here at Brenton point. Right into your inbox!