 Client Login

Economic Transition
Investing Environment Review and Outlook – Volume 50
Economic Transition
After a year-long boom phase when the economic outlook was strong and the economy itself accelerated upward, a subtle shift in our economic outlook indicators marks a new economic transition period. We shifted ratings this month to account for the new risks and opportunities.
Equity Ratings Downtick
This month we cut the U.S. Equities rating to a neutral 3 based on the economic outlook reversal, extreme investor positioning and the negative seasonality through September. We also cut foreign developed and emerging markets equities to a bullish 4 rating based on their high correlation with U.S. equities. As we discussed last month, foreign equities rate higher since they have less downside risk and more upside potential due to under ownership and economies still accelerating. We also raised the long-term bond rating to a neutral 3 based on the neutral economic outlook, and we cut the commodity rating to a neutral 3 as well. Gold remains a bullish 5 rating.
Economic Outlook Downticks to Neutral
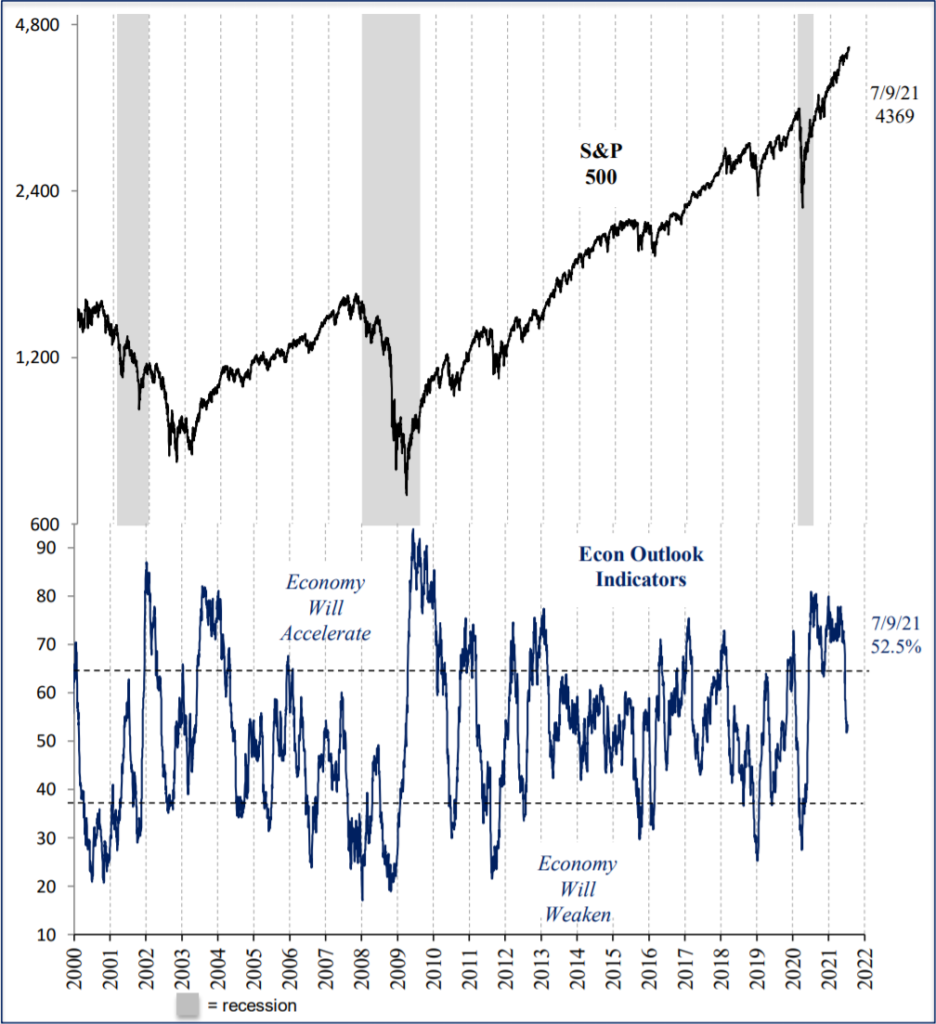
For the first time in over a year the economic outlook indicators downticked to neutral this month on the reversal in the 10-year yield to 1.3% from a March peak of 1.75%, weak commodity prices like copper and lumber, and slowing momentum in stock indices after a very strong 12 months. It signals a slowing of economic growth ahead from an unsustainable peak growth rate in the 2nd quarter. It also signals a possible exit from the boom phase of the economic cycle to either a Goldilocks period of slower growth and low inflation or stagflation when slowing growth is combined with high inflation. The consensus of economists expects peak GDP growth of 9.1% in Q2 falling to 3.8% by Q1 2022 as fiscal stimulus and the reopening surge fades.
In the last 20 years the S&P 500 returned 20.4% annualized (almost 3x the norm) when the economic outlook was strong and the Fed was loose, but just 3.0% when the economic outlook was neutral. When we consider other conditions today like extreme investor positioning and negative seasonality through September, the estimated annualized return for the S&P 500 is closer to the norm of 10%, appropriate for a neutral equity rating. It will allow us the flexibility to add exposure if conditions improve or cut back further if conditions deteriorate. As investor enthusiasm surges, it is a good time to focus on capital preservation as the top priority.
Economic Outlook Reversing
![]()
Economic Outlook vs. U.S. Equities
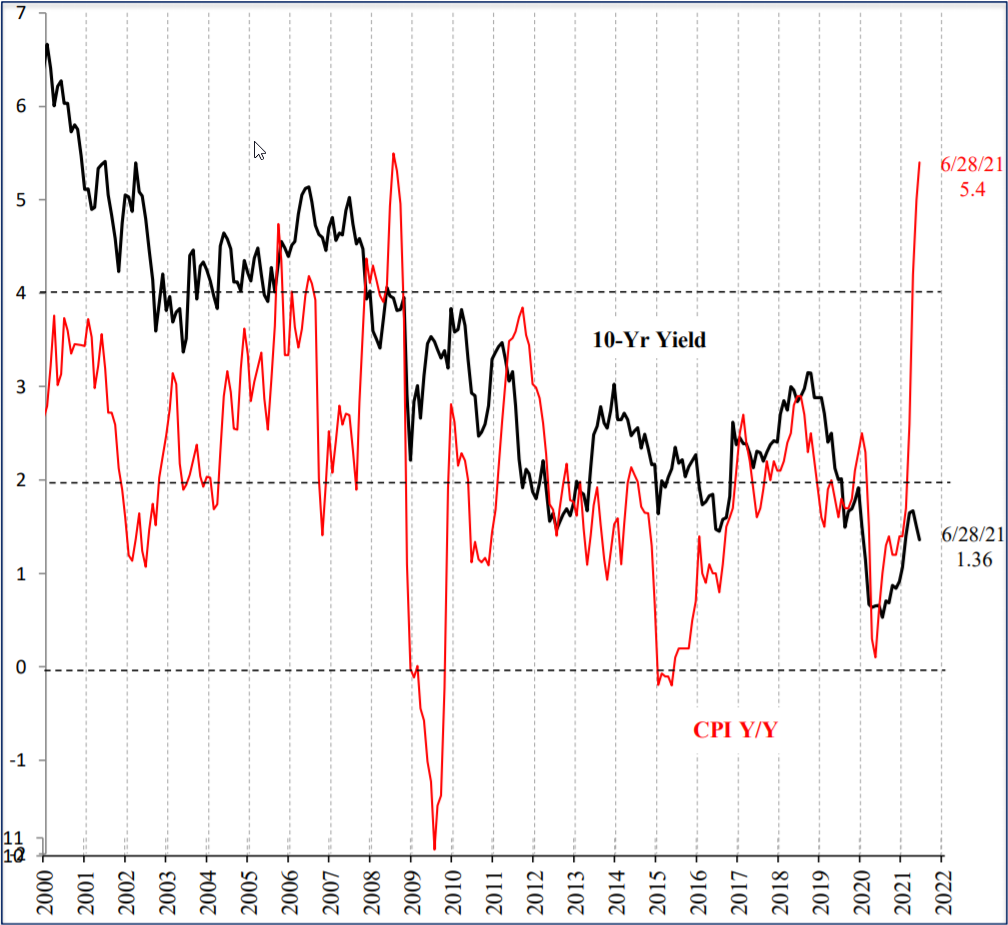
10-Year Treasury 4% Below Inflation
With inflation surprising economists by rising to 5.4% in June and consensus expecting an extreme 9.1% GDP growth in the second quarter that just ended, there is good reason for confusion why bond yields have declined since March to an extreme 4.0% below inflation. For comparison, since 1970 the 10-year yield averaged 2.2% over the inflation rate since 1970. For the short term, the simplest explanation is timing, that the 10-year yield moves ahead of the economy, which moves ahead of inflation. In other words, inflation is the most lagging indicator. Consider the sequence of events the last 12 months. The 10-year yield bottomed in August 2020 at 0.5% and rose until it peaked in March 2021 at 1.75%. Inflation then followed from 1.3% last August to 5.4% today. Bonds are not reacting to the inflation move since yields already moved higher. The recent decline in the 10-year yield may make more sense in 6 months when we look back if we see that economic growth and inflation followed lower.
10-Yr. Yield 4.0% Below Inflation
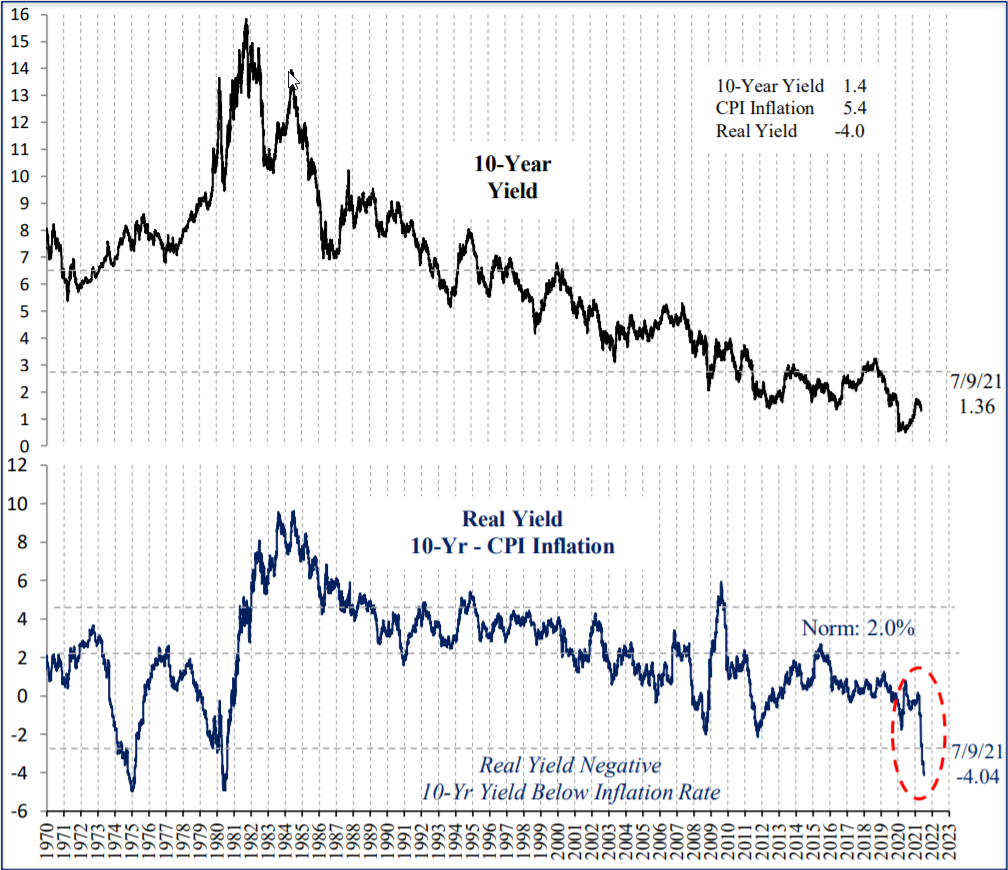
10-Yr. Yield Leads Inflation
Extreme 6 and 12-Month Stock Market Rally: Lower Returns Ahead
The S&P 500 was up 21% in the 2nd half of 2020 and another 15% in the first half of this year for a 12-month total of 38%. There were only 4 prior years up over 10% in both the first half and the prior 2nd half of the year. In those cases, the average prior 6-month return was 17.2%, followed by the next 6 month return averaging just 1/3 of that at 5.2%. The next 10% was higher in all 4 cases, but lower returns and a consolidation period would be normal, particularly in the next 3 months. This also coincides with the negative seasonal period of the year through September.
S&P 500 Returns after H1 and Prior H2 Up 10%

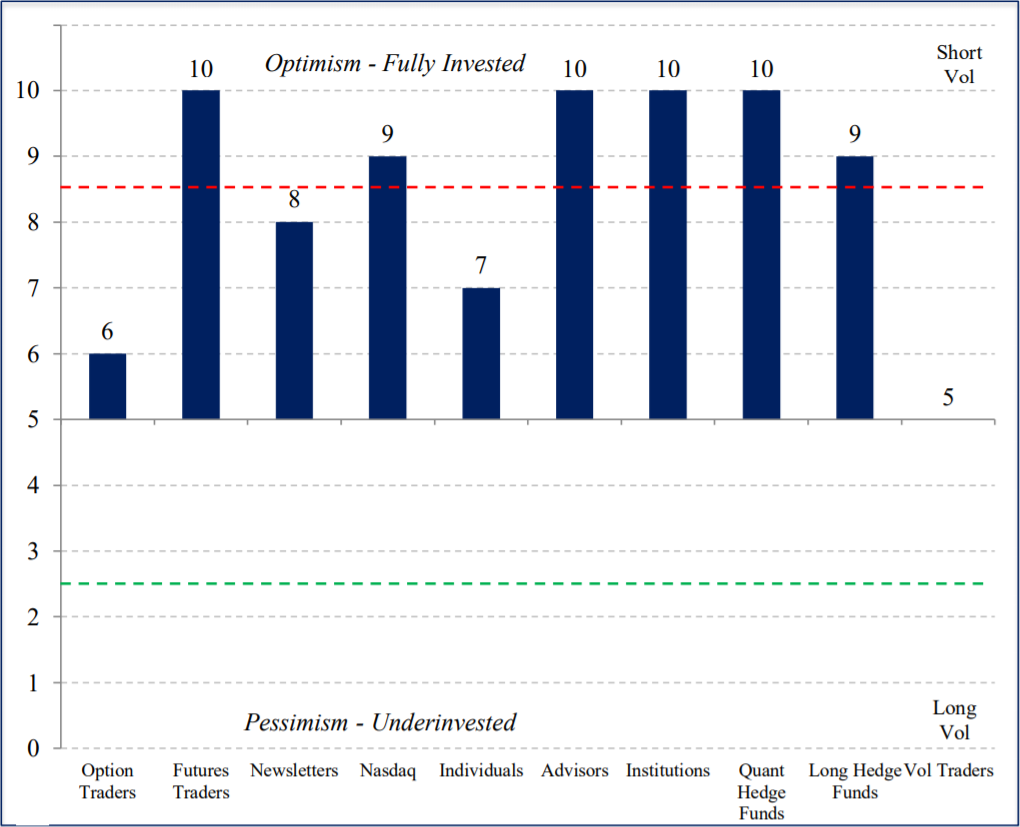
Investor Positioning Remains Extreme
After a 38% move in the S&P 500 over 12 months and no declines over 4% this year, it is no surprise that investors remain fully invested as a group. 6 of 10 investor groups we follow have reached the top deciles of their historical ranges. In prior cases a 5-10% decline occurred at some point, pushing the positioning indicators back to neutral and setting up the next leg higher.
Equity Investor Positioning Extreme 6 of 10 Groups Extreme
Summary
After a year of strong economic outlook indicators, accelerating economic growth, surging commodity prices and investor optimism during a classic boom phase of the economic cycle, we are now entering an economic transition phase with more uncertainty for asset prices. As a result, we are cutting risk by reducing equity and commodity ratings and moving bond ratings to neutral. If and when equity volatility returns, it may present opportunities to those with the cash to invest. We will continue to monitor conditions on a daily basis and adjust our outlook as the facts change. Thank you for your continued support and please contact your advisor with any questions.
IMPORTANT DISCLOSURES
This review and outlook report (this “Report”) is for informational, illustration and discussion purposes only and is not intended to be, nor should it be construed as, financial, legal, tax or investment advice, of Brenton Point Wealth Advisors LLC or any of its affiliates (“Brenton Point”). This Report does not take into account the investment objectives, financial situation, restrictions, particular needs or financial, legal or tax situation of any particular person and should not be viewed as addressing any recipient’s particular investment needs. Recipients should consider the information contained in this Report as only a single factor in making an investment decision and should not rely solely on investment recommendations contained herein, if any, as a substitution for the exercise of independent judgment of the merits and risks of investments.
This material is based upon information obtained from various sources that Brenton Point believes to be reliable, but Brenton Point makes no representation or warranty with respect to the accuracy or completeness of such information. Views expressed herein are current only as of the date indicated and are subject to change without notice.
This Report contains certain forward looking statements opinions, estimates, projections, assessments and other views (collectively “Statements”). These Statements are subject to a number of assumptions, risks and uncertainties which may cause actual results, performance or achievements to be materially different from future results, performance or achievements expressed or implied by these forward looking statements and projections. Brenton Point makes no representations as to the reasonableness of such assumptions or the likelihood that such assumptions will coincide with actual events and this information should not be relied upon for that purpose. Changes in such assumptions could produce materially different results. Past performance is not a guarantee or indication of future results, and no representation or warranty, express or implied, is made regarding future performance of any financial instrument mentioned in this Report.
Any benchmark shown herein is shown for illustrative purposes only. No index benchmark is available for direct investment. It may not be possible to replicate the returns of any index, as the index may not include any trading commissions and costs or fees, may assume the reinvestment of income, and may have investment objectives, use trading strategies, or have other materials characteristics, such as credit exposure or volatility, that do not make it suitable for a particular person. This is not an offer or solicitation for the purchase or sale of any security, investment, or other product and should not be construed as such. References to specific financial instruments and to certain indices are for illustrative purposes only and provided for the purpose of making general market data available as a point of reference only; they are not intended to be, and should not be interpreted as recommendations to purchase or sell such securities. Investing in securities and other financial products entails certain risks, including the possible loss of the entire principal amount invested, as the value of investment can go down as well as up. You should obtain advice from your tax, financial, legal, and other advisors and only make investment decisions on the basis of your own objectives, experience, and resources.
Brenton Point accepts no liability for any loss (whether direct, indirect or consequential) occasioned to any person acting or refraining from action as a result of any material contained in or derived from this Report, except to the extent (but only to the extent) that such liability may not be waived, modified or limited under applicable law.
This Report may provide addresses of, or contain hyperlinks to, Internet websites. Brenton Point has not reviewed the linked Internet website of any third party and takes no responsibility for the contents thereof. Each such address or hyperlink is provided solely for your convenience and information, and the content of linked third party websites is not in any way incorporated herein. Recipients who choose to access such third-party websites or follow such hyperlinks do so at their own risk.
All marks referenced herein are the property of their respective owners. This Report is licensed for non-commercial use only, and may not be reproduced, distributed, forwarded, posted, published, transmitted, uploaded or otherwise made available to others for commercial purposes, including to individuals within an institution, without written authorization from Brenton Point.
Source of data and performance statistics: Bloomberg L.P. and Factset Research Systems Inc.
©Brenton Point Wealth Advisors LLC 2021

Michael Schaus
Director of Market Research
Michael Schaus is the Director of Market Research for Brenton Point Wealth Advisors and Zweig-DiMenna. Since joining Zweig-DiMenna in 1992, his focus has been on macroeconomic research, the analysis of…
READ MORE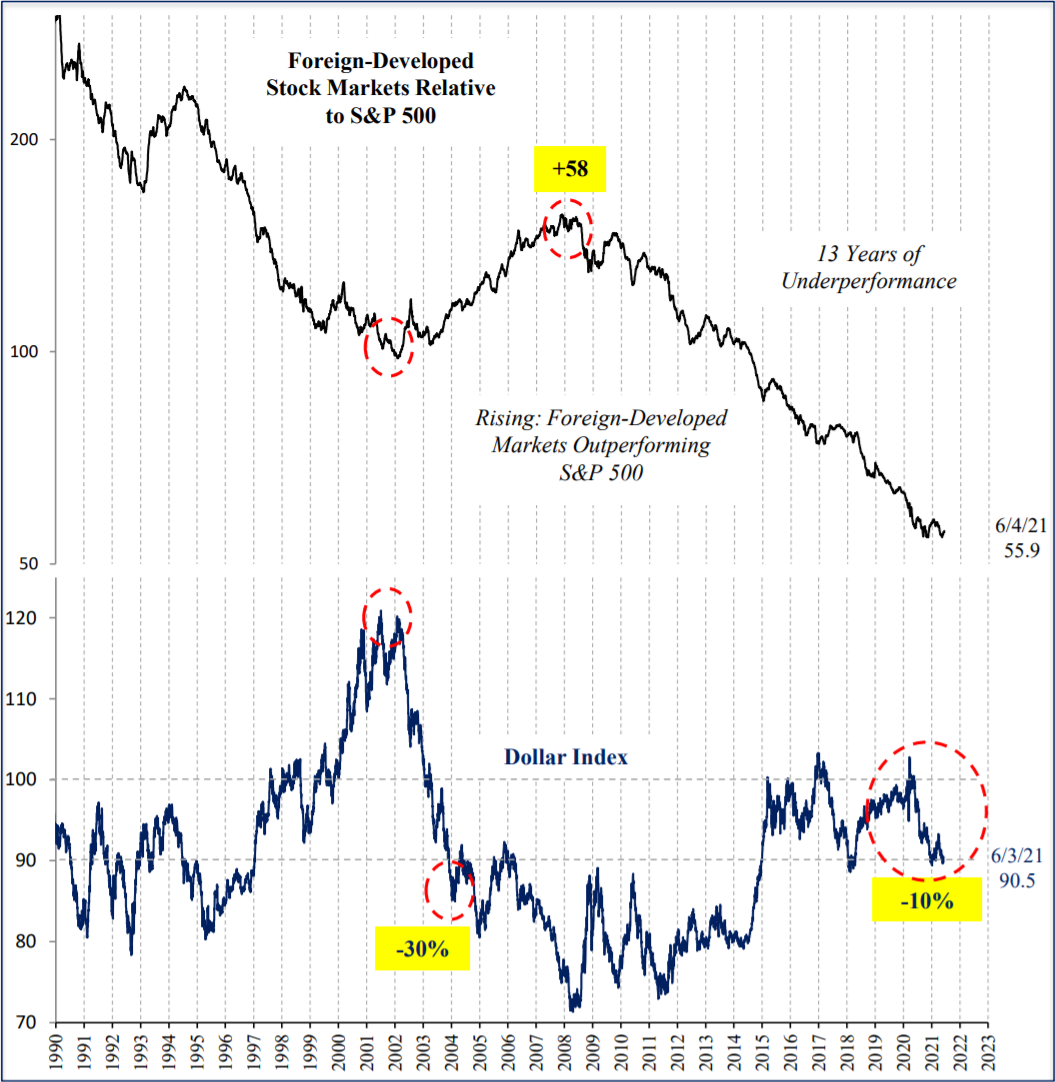
Sign up!
Sign up for our monthly newsletter and get the lastest news and research from our esteemed advisors here at Brenton point. Right into your inbox!