 Client Login

Fed Policy Shifts: Positive for Equities
Investing Environment Review and Outlook – Volume 48
The boom phase of the economic cycle is more evident every week. Aside from strong earnings and higher stock prices, more recent items in the news typical of this stage include record home and auto sales, the jump in consumer confidence surveys, rising margin debt, record high copper and lumber prices, and even record super yacht orders in the Netherlands! At the root of the boom phase is pervasive high confidence, from consumers to investors to corporate managers–the mirror image of the extreme pessimism and panic from 2020. The recent media focus on inflation and Fed policy is logical, since historically inflation was the crucial variable. In prior cycles, rising inflation forced the Fed to tighten monetary conditions, which led to bear markets and recessions. Inflation is already up to 2.6% through March from just 0.1% a year ago, and the consensus forecast is 3.6% for April.
Despite the debate on whether this inflation move is temporary or not, there is no question a change in Fed policy is coming. It is just a matter of when. This month we look at the surprising implications of prior initial Fed interest rate hikes back to 1946. We also review the effect of prior capital gains tax hikes, and the typically weak period for equities between May and September. Asset ratings are unchanged this month. U.S. equities remain a bullish 4. Foreign developed and emerging markets remain a bullish 5 along with gold and commodities. Long-term bonds remain a cautious 1 rating.
Fed Policy Shifts: Positive for Equities
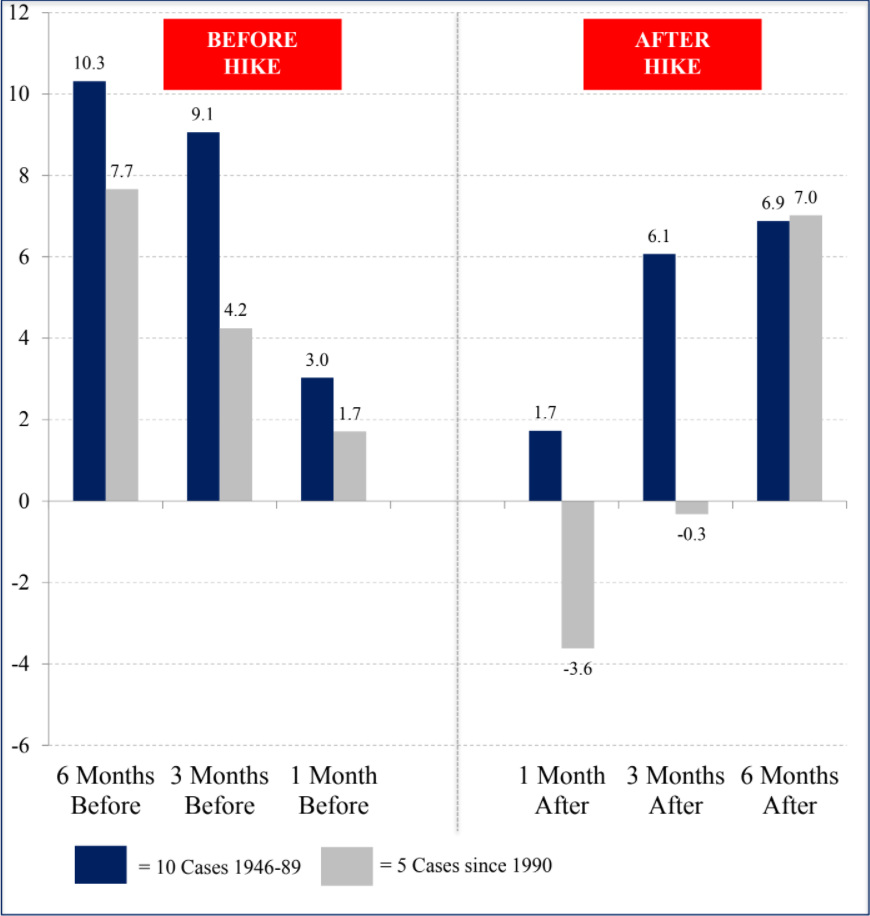
Marty Zweig coined the phrase “Don’t Fight the Fed” for good reason. Prior bull markets and economic expansions are usually terminated by the Fed hiking rates to stop rising inflation. However, initial Fed moves were surprisingly benign for equities. Consider that 6 months after the 15 initial Fed interest rate hikes since 1945, the S&P 500 was higher in 13 of those, with an average return of 6.9%–better than the norm of 5.5%. Returns were even better in the 6 months prior with a 10.3% average move.
However, in the short term after more recent initial hikes, equity returns were mixed. For instance, of the 5 initial hikes since 1990, the average return 3 months out was down 0.3%, and just 1 of the 5 was higher. In addition, the next 6% move after the initial hike was down in all 5 cases. In other words, equities will likely be mixed in the 3 months after the initial hike, but further out, positive returns are likely, and the bull market is not at risk. In fact, the next 10% S&P 500 move after initial hikes was up in 13 of 15 cases since 1945 and in 4 out of 5 cases since 1990. Although the Fed is likely to kill the bull market eventually, their first shot, whenever it comes, is not the one to fear.
Initial Fed Interest Rate Hikes S&P 500 Returns
May-September Period: Weak for Equities but Large Decline Unlikely
Historically, May to September was the worst period of the year for the S&P 500, averaging just a 1.0% return since 1950 vs. 7.7% in the October through April period. This year the S&P 500 has been quite strong up 11.8% through April, following an 11.7% return in Q4. Aside from the extreme investor positioning we discussed last month, there are two implications of this strong performance.
The good news is the worst May-September years were preceded by negative returns in January through April, which is not the case this year. In other words, of the 9 cases down over 10% in the May-September period, 8 of those were preceded by a decline in January to April 15th. This year January to April 15th was up 11.5%.
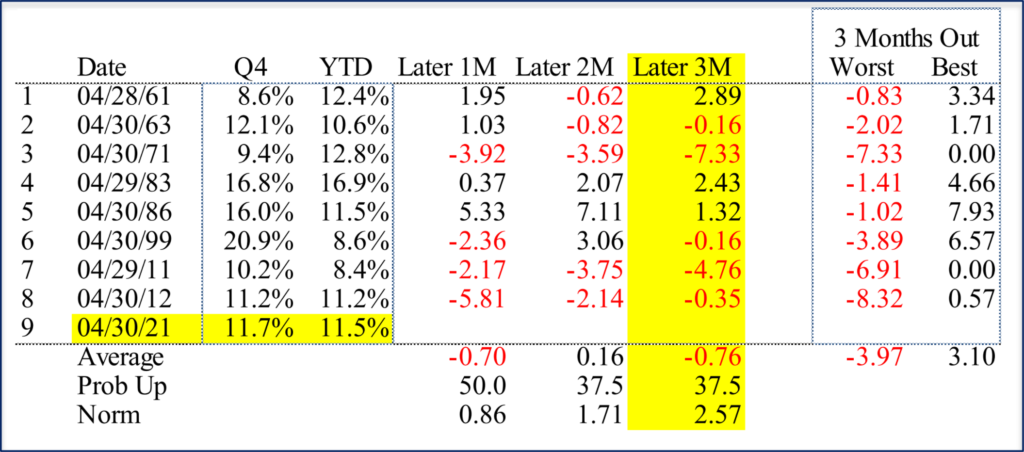
Although major declines like the -25% return in 2002 are less of a risk, forward returns were uninspiring. In fact, in the 8 prior cases the S&P 500 was up over 8% in both Q4 and in the January to April periods like this year, the next 3 months averaged -0.7%, and just 3 of 8 were higher. However, the 3-month average max decline was -4%–not a disaster. In this context, a bullish 4 rating is appropriate for equities, allowing us flexibility to add exposure if we see weakness and lower investor positioning.
S&P 500 Returns After Q4 and Jan – April up 8%
Capital Gains Tax Hikes: Flat Prior/Up Afterwards
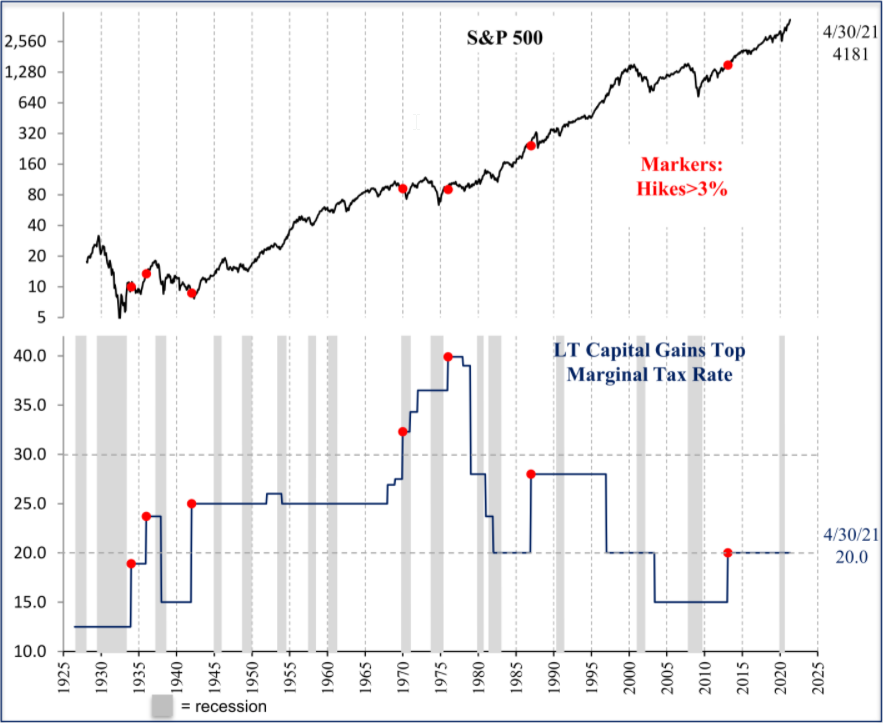
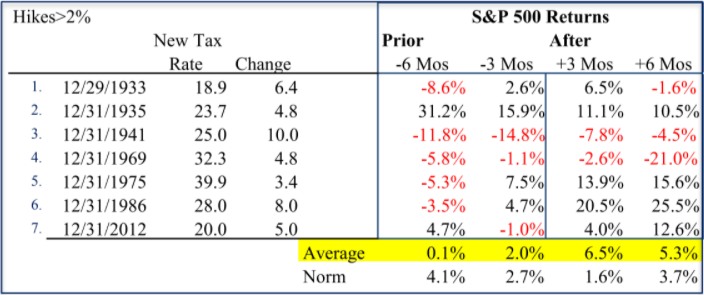
President Biden’s plan to rebuild the U.S. economy includes a proposed near doubling of capital gains taxes on certain income earners. Although the actual size of the increase and its effective date are unknowable at this point, the pattern around prior tax hikes might be surprising. Of the 7 prior capital gains tax hikes over 3% since 1928, returns in the prior 6 months ahead of the effective date were flat at 0.1%, and just 2 of 7 cases higher. The S&P 500 was strong in the 3 months after hikes, with an average 7% return and 5 of 7 cases higher. In other words, returns are flat to mixed prior to the tax hike and strong afterwards. The historical return pattern suggests some planned equity sales are pulled forward prior to the hike, putting some downward pressure on returns, while leaving fewer than normal sales afterwards, pushing returns higher after the hike. However, it does not appear that a capital gains tax hike would cause a stock market shock as some are saying. The 1986 case was the most extreme, with a 3.5% decline in the 6 months prior, and a 20.5% rally 3 months after the tax hike was in effect.
Top Marginal Capital Gains Tax Rate Hikes 1928 –
S&P 500 Returns Around Capital Gains Tax Hikes 7 Prior Cases 1933-2012
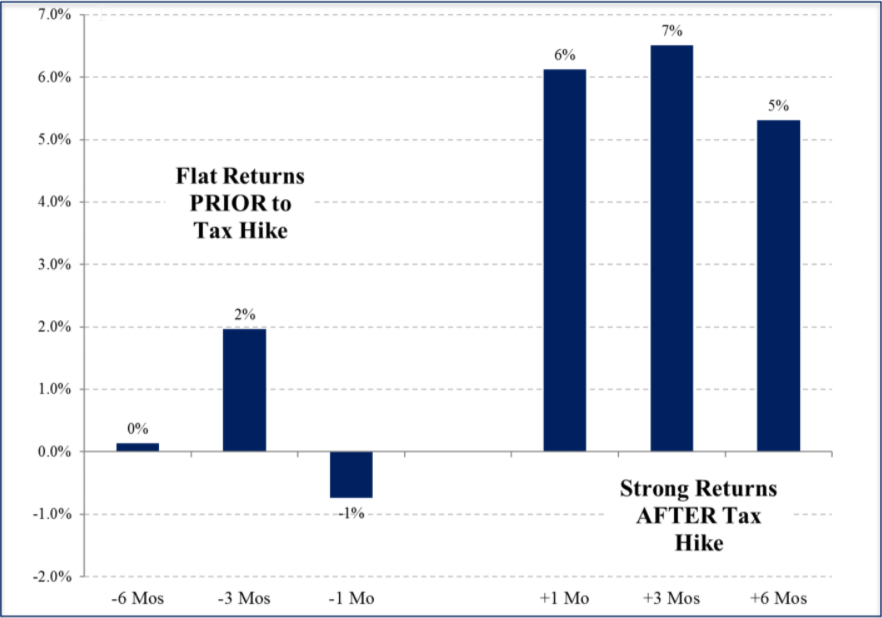
S&P 500 Returns Around Capital Gains Tax Hikes Flat Prior/Strong Afterwards
Summary
The early stages of the boom phase are positive for equities, gold and commodities, and bearish for bonds as interest rates are likely to rise further with inflation. The negative seasonal period of the year combined with extreme investor positioning is good reason to expect more mixed S&P 500 returns in the next 3 months as recent stock market gains are consolidated. However, the bull market should remain intact as long as the economic outlook remains positive, and the Fed remains loose. Once inflation breaks 4% and/or the Fed begins hiking rates, equity bear market and recession risks will increase. We will continue watching our indicators on a daily basis. Thank you for your support and please contact your advisor with any questions.
IMPORTANT DISCLOSURES
This review and outlook report (this “Report”) is for informational, illustration and discussion purposes only and is not intended to be, nor should it be construed as, financial, legal, tax or investment advice, of Brenton Point Wealth Advisors LLC or any of its affiliates (“Brenton Point”). This Report does not take into account the investment objectives, financial situation, restrictions, particular needs or financial, legal or tax situation of any particular person and should not be viewed as addressing any recipient’s particular investment needs. Recipients should consider the information contained in this Report as only a single factor in making an investment decision and should not rely solely on investment recommendations contained herein, if any, as a substitution for the exercise of independent judgment of the merits and risks of investments.
This material is based upon information obtained from various sources that Brenton Point believes to be reliable, but Brenton Point makes no representation or warranty with respect to the accuracy or completeness of such information. Views expressed herein are current only as of the date indicated and are subject to change without notice.
This Report contains certain forward looking statements opinions, estimates, projections, assessments and other views (collectively “Statements”). These Statements are subject to a number of assumptions, risks and uncertainties which may cause actual results, performance or achievements to be materially different from future results, performance or achievements expressed or implied by these forward looking statements and projections. Brenton Point makes no representations as to the reasonableness of such assumptions or the likelihood that such assumptions will coincide with actual events and this information should not be relied upon for that purpose. Changes in such assumptions could produce materially different results. Past performance is not a guarantee or indication of future results, and no representation or warranty, express or implied, is made regarding future performance of any financial instrument mentioned in this Report.
Any benchmark shown herein is shown for illustrative purposes only. No index benchmark is available for direct investment. It may not be possible to replicate the returns of any index, as the index may not include any trading commissions and costs or fees, may assume the reinvestment of income, and may have investment objectives, use trading strategies, or have other materials characteristics, such as credit exposure or volatility, that do not make it suitable for a particular person. This is not an offer or solicitation for the purchase or sale of any security, investment, or other product and should not be construed as such. References to specific financial instruments and to certain indices are for illustrative purposes only and provided for the purpose of making general market data available as a point of reference only; they are not intended to be, and should not be interpreted as recommendations to purchase or sell such securities. Investing in securities and other financial products entails certain risks, including the possible loss of the entire principal amount invested, as the value of investment can go down as well as up. You should obtain advice from your tax, financial, legal, and other advisors and only make investment decisions on the basis of your own objectives, experience, and resources.
Brenton Point accepts no liability for any loss (whether direct, indirect or consequential) occasioned to any person acting or refraining from action as a result of any material contained in or derived from this Report, except to the extent (but only to the extent) that such liability may not be waived, modified or limited under applicable law.
This Report may provide addresses of, or contain hyperlinks to, Internet websites. Brenton Point has not reviewed the linked Internet website of any third party and takes no responsibility for the contents thereof. Each such address or hyperlink is provided solely for your convenience and information, and the content of linked third party websites is not in any way incorporated herein. Recipients who choose to access such third-party websites or follow such hyperlinks do so at their own risk.
All marks referenced herein are the property of their respective owners. This Report is licensed for non-commercial use only, and may not be reproduced, distributed, forwarded, posted, published, transmitted, uploaded or otherwise made available to others for commercial purposes, including to individuals within an institution, without written authorization from Brenton Point.
Source of data and performance statistics: Bloomberg L.P. and Factset Research Systems Inc.
©Brenton Point Wealth Advisors LLC 2021

Michael Schaus
Director of Market Research
Michael Schaus is the Director of Market Research for Brenton Point Wealth Advisors and Zweig-DiMenna. Since joining Zweig-DiMenna in 1992, his focus has been on macroeconomic research, the analysis of…
READ MORE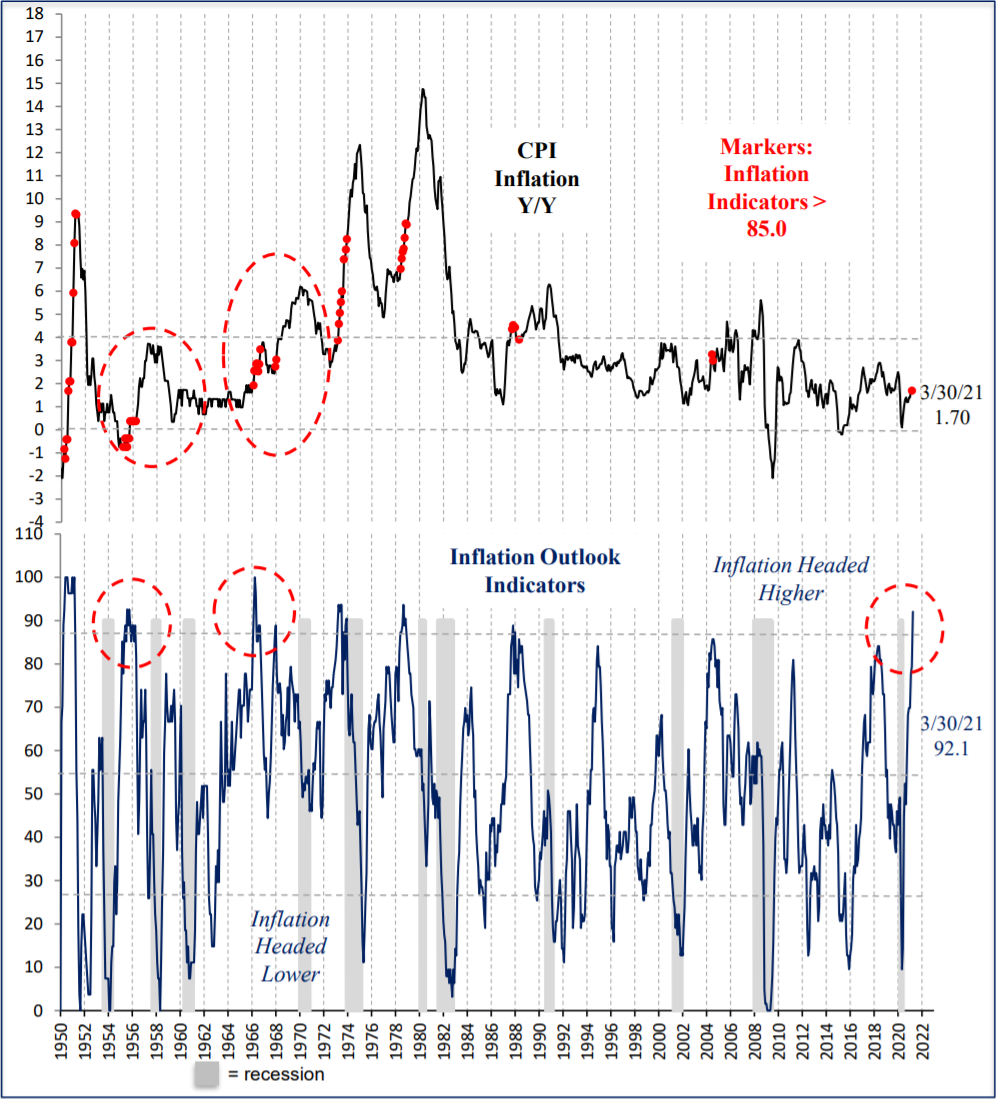

Sign up!
Sign up for our monthly newsletter and get the lastest news and research from our esteemed advisors here at Brenton point. Right into your inbox!