 Client Login

Fight the Fed
Investing Environment Review and Outlook – Volume 61
Fight the Fed
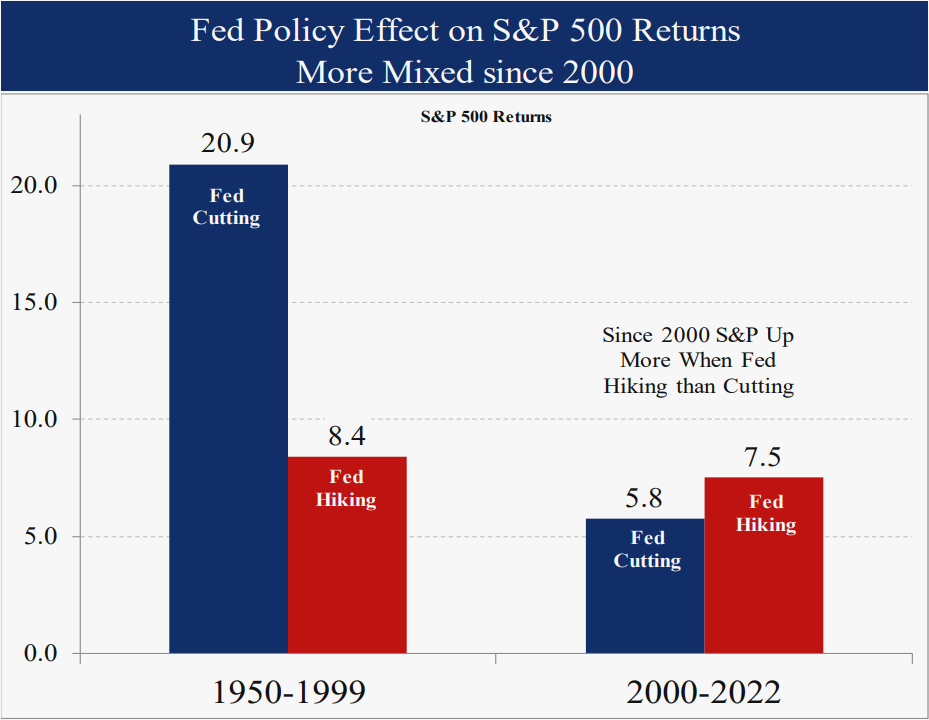
Last month we discussed the potential turning point for equities at the June Fed meeting when they hiked 0.75% in one of the most anticipated Fed moves ever. Perhaps surprising given the cascade of bearish headlines since then, a month later the S&P 500 was 1.8% higher. Conditions for equities were negative most of the year with high and rising inflation, the Fed hiking rates and the 10-year yield rising, a toxic combination for equities historically back to 1970. Since that Fed meeting, media headlines have repeated the high inflation, hawkish Fed and recession stories, missing how conditions actually shifted dramatically for the better. This month we discuss what changed and why we are indeed fighting the Fed.
Ratings are unchanged this month with U.S. and foreign developed equities at a neutral 3 and emerging markets a bullish 5. Long term bonds are a neutral 3. Gold remains a bullish 5 and commodities are a neutral 3.
Treasury Yields Down: Positive
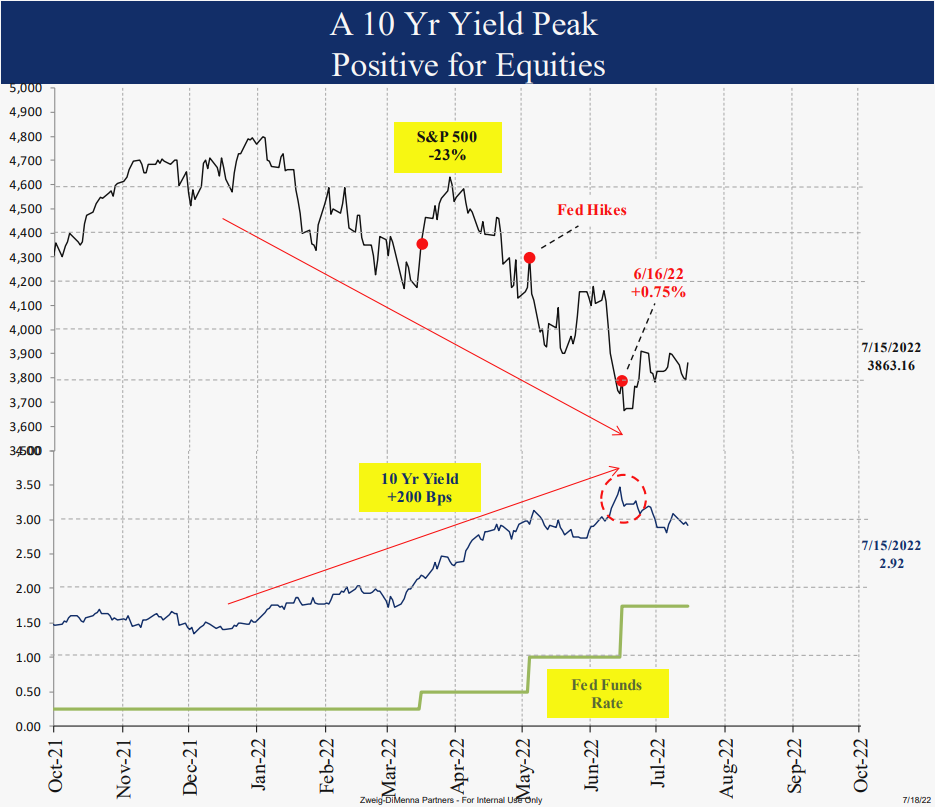
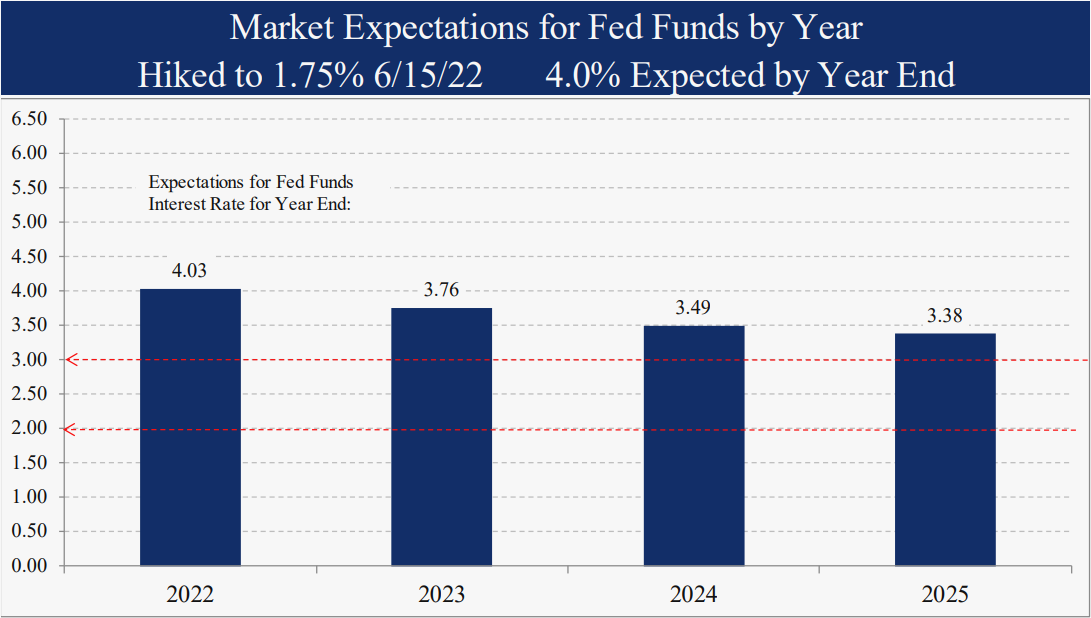
From January 1st to June 16th when the Fed hiked the third time by 0.75%, the 10-year yield rose 200 bps from 1.5% to 3.5% while the S&P 500 declined 23%. Since that hike, however, the 10-year Treasury yield declined 0.70% from 3.50 to 2.80 on 7/6/22. 2-year yields had a similar move. The turn in the 10 year confirms the inflection point we discussed last month. While this peak in rates holds, the pattern of higher yields and lower stock prices has reversed with lower yields and higher stock prices instead. Notice the sharp decline in the S&P 500 and run-up of the 10-year yield prior to the June meeting. So far, the 10-year yield has not shown the same tendency ahead of next week’s Fed meeting despite the consensus for another 0.75% hike. The leveling of the 10-year yield likely marks a coming pause in Fed hikes by year-end despite their hawkish rhetoric. This is a big change and a bullish shift for equities.
Inflation Peak: Positive
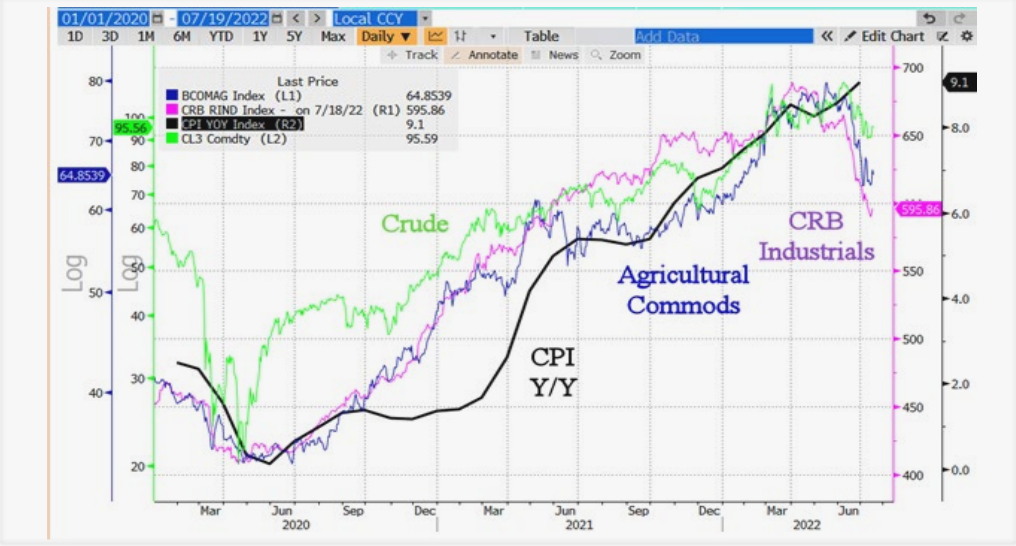
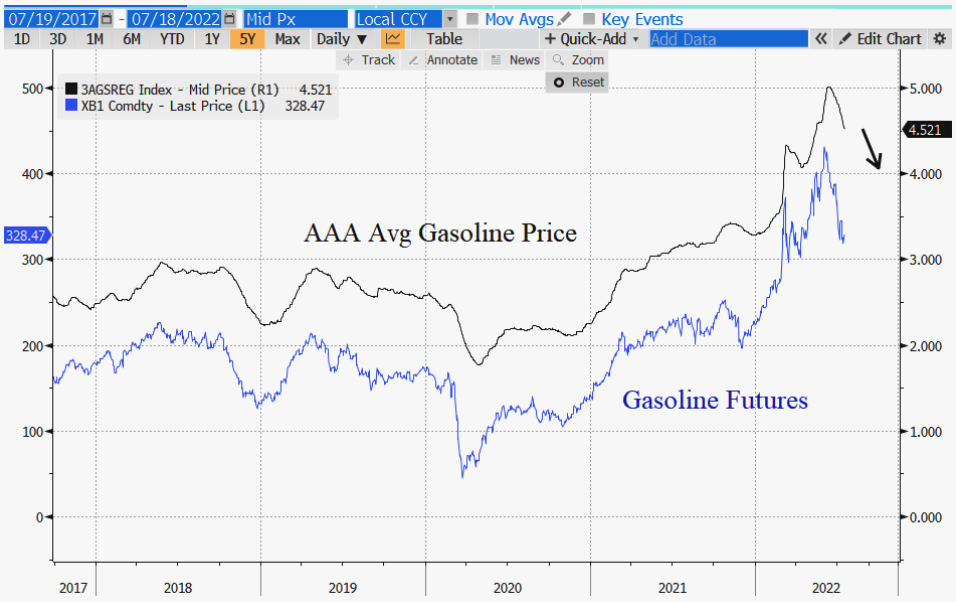
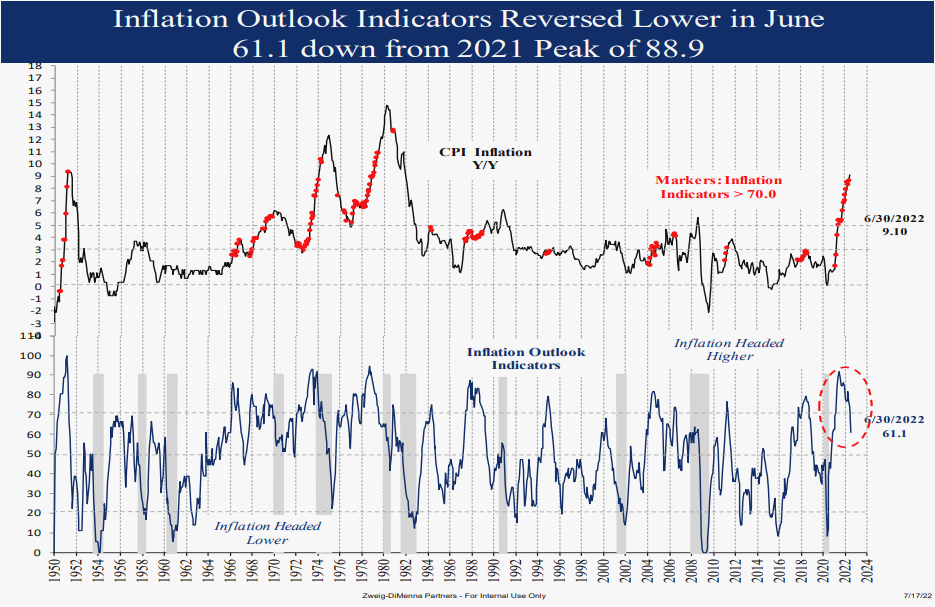
The 9.1% print for the June Consumer Price Index inflation last week made headlines as it should have, it was the highest reading in 40 years back to November 1981. This was certainly news, yet it was telling neither bonds nor stocks reacted to the downside, probably because there is now strong evidence that the inflation peak is at hand. Industrial commodities as a group are down 14% from the April peak, reversing 1/3 of the post COVID 2020 rally. Agricultural commodities as measured by the Bloomberg Agricultural index are down 20% from the May peak, now even below the pre Ukraine invasion level that sent food prices higher. Finally crude oil is down 23% from the June peak, also matching the pre Ukraine invasion level.
Low unemployment is a legitimate inflation risk for inflation higher for longer, yet even average hourly earnings are down from a recent peak of 5.6% to 5.1% Y/Y in June. There are numerous signs among realtors that housing (31% of CPI) has peaked as well with less demand and more supply. Finally, our inflation outlook indicators reversed significantly lower to 61 from a 2021 peak of 89. This model was a good leading indicator last year, rising from a low of 10 in 2020 to 70 in February 2021 when CPI inflation was just 1.7%.
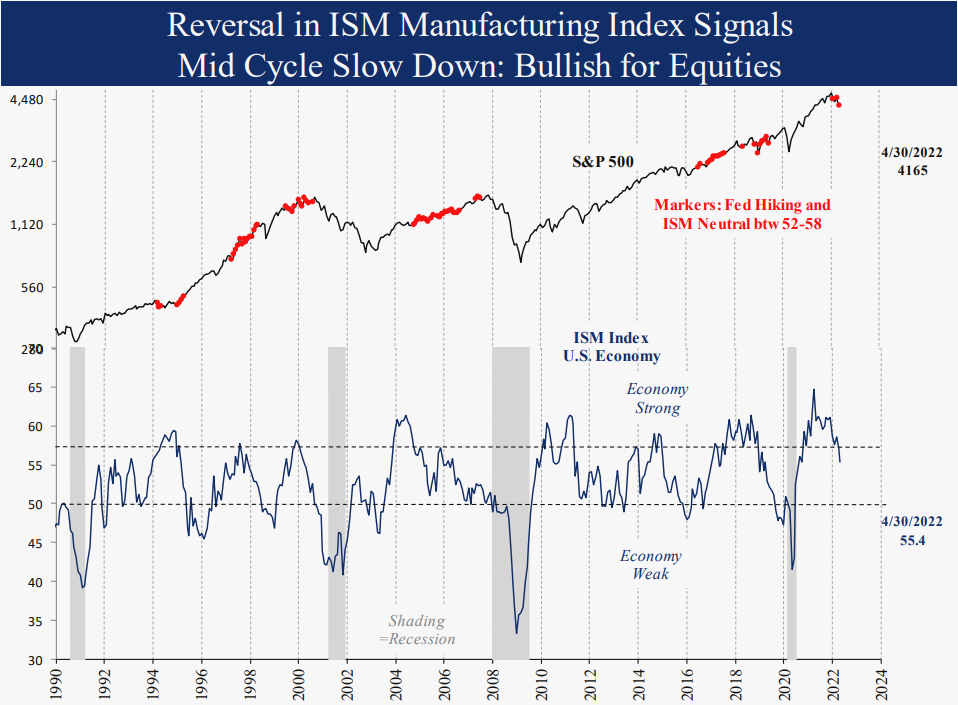
Combining the reversal in the 10-year yield with a likely peak in CPI inflation, the historical return for the S&P 500 was a counter intuitive 30% since 1970, 3x the norm even when inflation was high over 4% and the Fed was hiking. Equities discount the future, and monetary conditions have improved significantly. The slowing economy and reversal in commodity prices are positive for equities when the Fed is hiking, at odds with the consensus view these are signaling an imminent recession and deeper bear market ahead.
Dollar Extreme: Reversal Positive for Emerging Markets and Gold
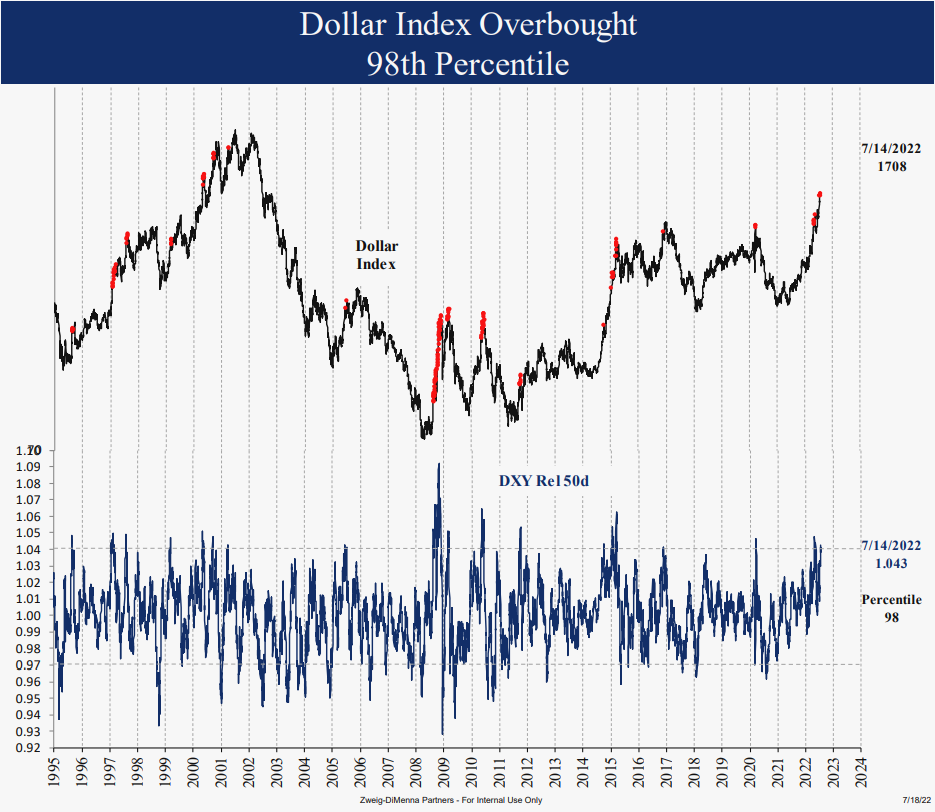
Since the May 2021 low the dollar index is up 21%, the biggest rally since 2015. At the peak on 7/14 it was overbought in the 98th percentile relative to the 50-day average. In other words, the dollar was only stronger 2% of the time, with a high probability of a reversal lower. Sentiment has reached an extreme as well. The DSI survey of futures traders showed 95% bulls and only 5% bears. Last week an analyst called the Euro “uninvestable.” Gold and emerging markets have been disappointing investments this year, but historically a weak dollar was one of the most bullish indicators. For instance, emerging markets returned 21% and gold returned 15% annualized when the Fed was hiking rates and the dollar index was falling. The price earnings ratio of the MSCI emerging markets index is just 9.6, half that of the S&P 500 at 19.7. The emerging markets index and gold ratings both remain a bullish 5.
Summary
The evident slowing in the economy this year is misunderstood to mean an imminent recession and deeper bear market ahead, but our historical analysis shows the opposite. While there is always a recession ahead at some point, the current conditions of a slowing economy, weaker commodities and a reversal in Treasury bond yields were bullish for equities even when the Fed was hiking and inflation was high over 4%. If the extreme move in the dollar is followed by a reversal like most prior cases, historically that translated into strong returns ahead for foreign equities like emerging markets and gold. It is certainly too soon to say the equity bear market is over, but what we do know is that conditions are positive for now. We will continue to monitor our diverse indicator database and keep you posted. Thank you for your support and please contact us with any questions.
IMPORTANT DISCLOSURES
This review and outlook report (this “Report”) is for informational, illustration and discussion purposes only and is not intended to be, nor should it be construed as, financial, legal, tax or investment advice, of Brenton Point Wealth Advisors LLC or any of its affiliates (“Brenton Point”). This Report does not take into account the investment objectives, financial situation, restrictions, particular needs or financial, legal or tax situation of any particular person and should not be viewed as addressing any recipient’s particular investment needs. Recipients should consider the information contained in this Report as only a single factor in making an investment decision and should not rely solely on investment recommendations contained herein, if any, as a substitution for the exercise of independent judgment of the merits and risks of investments.
This material is based upon information obtained from various sources that Brenton Point believes to be reliable, but Brenton Point makes no representation or warranty with respect to the accuracy or completeness of such information. Views expressed herein are current only as of the date indicated and are subject to change without notice.
This Report contains certain forward looking statements opinions, estimates, projections, assessments and other views (collectively “Statements”). These Statements are subject to a number of assumptions, risks and uncertainties which may cause actual results, performance or achievements to be materially different from future results, performance or achievements expressed or implied by these forward looking statements and projections. Brenton Point makes no representations as to the reasonableness of such assumptions or the likelihood that such assumptions will coincide with actual events and this information should not be relied upon for that purpose. Changes in such assumptions could produce materially different results. Past performance is not a guarantee or indication of future results, and no representation or warranty, express or implied, is made regarding future performance of any financial instrument mentioned in this Report.
Any benchmark shown herein is shown for illustrative purposes only. No index benchmark is available for direct investment. It may not be possible to replicate the returns of any index, as the index may not include any trading commissions and costs or fees, may assume the reinvestment of income, and may have investment objectives, use trading strategies, or have other materials characteristics, such as credit exposure or volatility, that do not make it suitable for a particular person. This is not an offer or solicitation for the purchase or sale of any security, investment, or other product and should not be construed as such. References to specific financial instruments and to certain indices are for illustrative purposes only and provided for the purpose of making general market data available as a point of reference only; they are not intended to be, and should not be interpreted as recommendations to purchase or sell such securities. Investing in securities and other financial products entails certain risks, including the possible loss of the entire principal amount invested, as the value of investment can go down as well as up. You should obtain advice from your tax, financial, legal, and other advisors and only make investment decisions on the basis of your own objectives, experience, and resources.
Brenton Point accepts no liability for any loss (whether direct, indirect or consequential) occasioned to any person acting or refraining from action as a result of any material contained in or derived from this Report, except to the extent (but only to the extent) that such liability may not be waived, modified or limited under applicable law.
This Report may provide addresses of, or contain hyperlinks to, Internet websites. Brenton Point has not reviewed the linked Internet website of any third party and takes no responsibility for the contents thereof. Each such address or hyperlink is provided solely for your convenience and information, and the content of linked third party websites is not in any way incorporated herein. Recipients who choose to access such third-party websites or follow such hyperlinks do so at their own risk.
All marks referenced herein are the property of their respective owners. This Report is licensed for non-commercial use only, and may not be reproduced, distributed, forwarded, posted, published, transmitted, uploaded or otherwise made available to others for commercial purposes, including to individuals within an institution, without written authorization from Brenton Point.
Source of data and performance statistics: Bloomberg L.P. and Factset Research Systems Inc.
©Brenton Point Wealth Advisors LLC 2022

Michael Schaus
Director of Market Research
Michael Schaus is the Director of Market Research for Brenton Point Wealth Advisors and Zweig-DiMenna. Since joining Zweig-DiMenna in 1992, his focus has been on macroeconomic research, the analysis of…
READ MORERead Next:
Sign up!
Sign up for our monthly newsletter and get the lastest news and research from our esteemed advisors here at Brenton point. Right into your inbox!