 Client Login

Month of Extremes
Investing Environment Review and Outlook – Volume 59
Month of Extremes
Amid the extreme equity market volatility, war and inflation headlines, Fed interest rate hikes and recession predictions, investors might be missing the emergence of a normal mid-cycle economic slowdown and the counter intuitive implications for forward asset returns. This month we discuss this inflection point, the S&P 500 valuation relative to interest rates, extreme investor positioning, and the gold decline in historical context.
We raised the U.S. and foreign-developed equities ratings to a neutral 3. Emerging markets remain a neutral 3. We also raised long-term bonds to a neutral 3 rating. Gold remains a bullish 5 and commodities are a neutral 3.
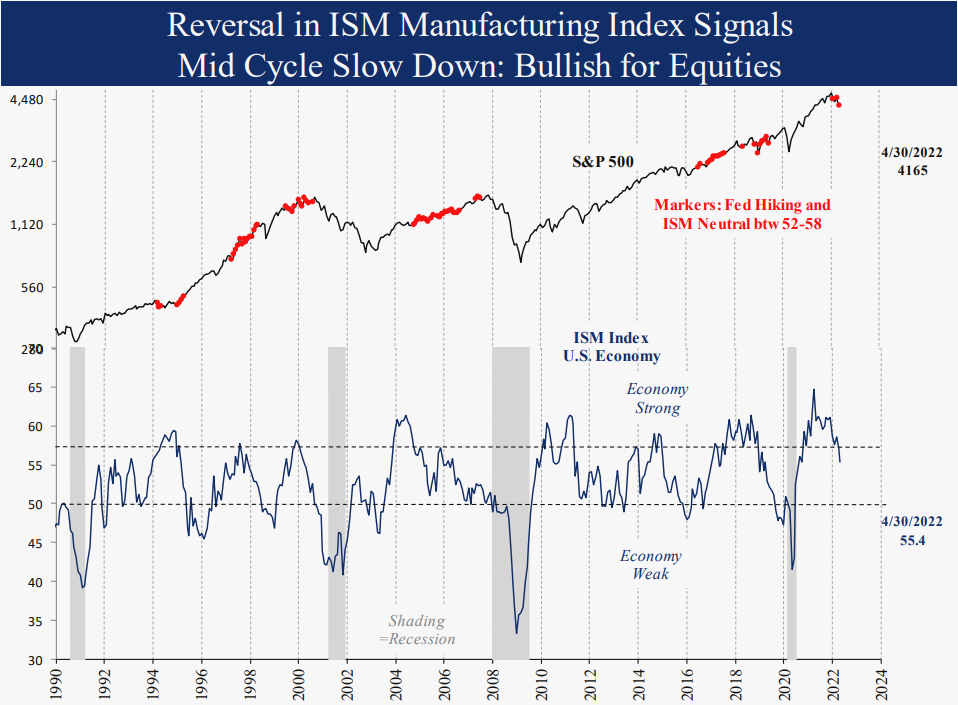
Mid Cycle Economic Slow Down: Bullish for Bonds and Equities
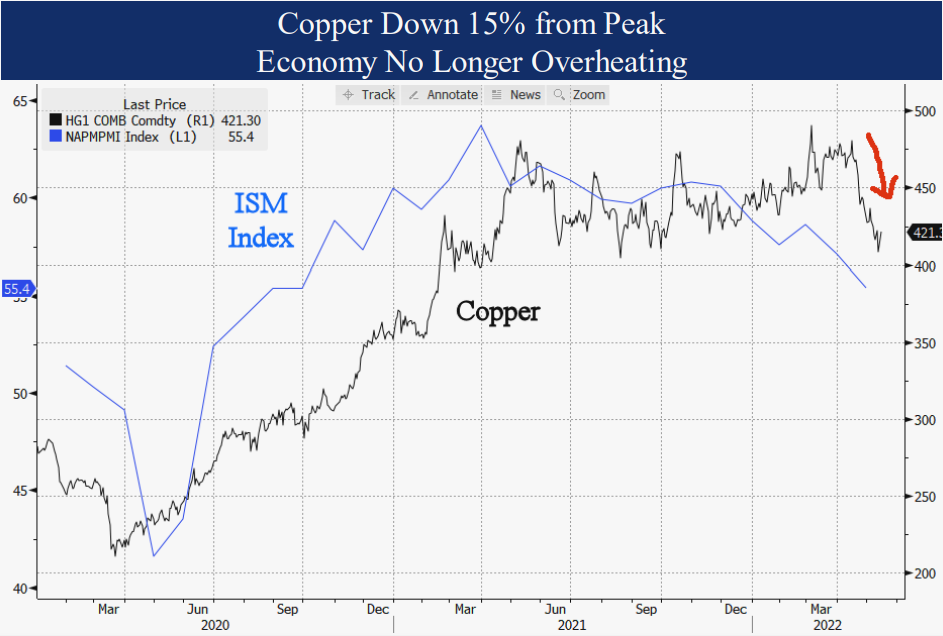
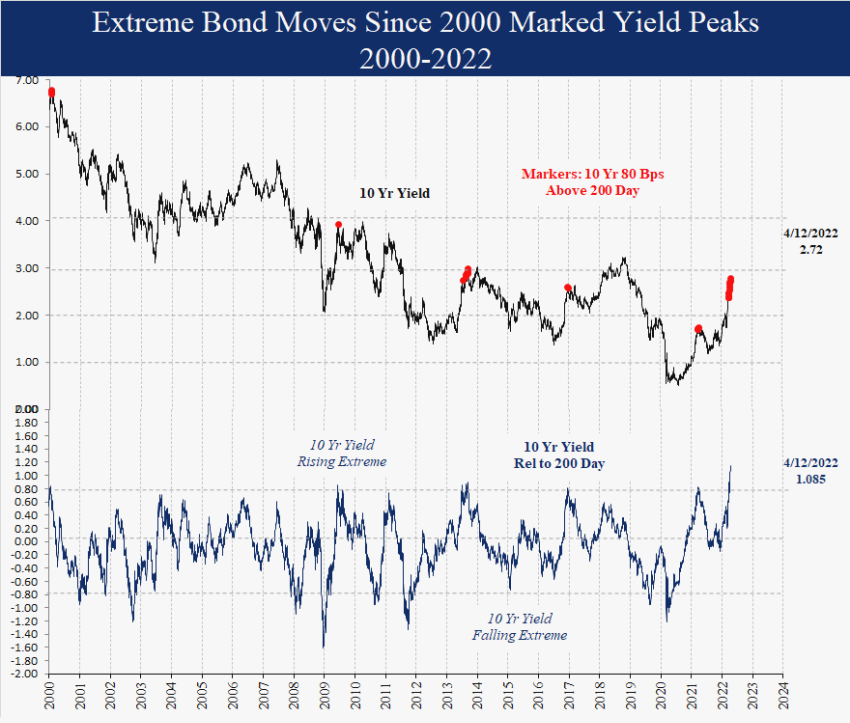
While potential causes of a slower economy are numerous, like higher interest rates, the China COVID lockdown, or the decline in government spending, the evidence of a slowdown is pretty clear. For instance, the ISM manufacturing index declined again in April to 55.4 from 58.7 at year end and from the post COVID peak of 64.7 in March 2021. The 10-year Treasury yield also reversed lower by 0.4% from a peak of 3.2% to 2.8%, on 5/12. Copper is down 15% in the last month along with other base metals like Nickel and Zinc, all used in manufacturing. The CRB Industrials index is also down over 5% from the recent peak, the biggest decline since the COVID low in April 2020. After a neutral reading since June 2021, our economic outlook indicators downticked to a weak 39 reading on 5/13, indicating the ISM may slow further in the next 3 months.
Although there is always a risk of a recession at some point, so far, this economic move is quite normal for an economic recovery. For instance, in the last expansion from 2009 to 2020 there were 3 separate mid cycle slowdowns before the 2020 recession. During the 1990-2000 cycle there were 4 separate slowdowns before the 2001 recession.
When the Fed is cutting rates, a strong economy and strong economic outlook are bullish for equities. That is intuitive, since most investors equate a strong economy with higher stock prices. However, when the Fed is hiking rates to reverse inflation, a slowing economy and weaker economic outlook are bullish for equities historically, for instance like 2005, 1994 or 1984. Lower commodity prices like copper are accompanied by lower long-term interest rates as economic demand slows. Empirical evidence bears this out. Since 1970 when the Fed was hiking rates, the S&P 500 returned -7.2% annualized when the ISM was strong over 58 compared to a 13.3% return when the ISM was neutral, the conditions we have today.
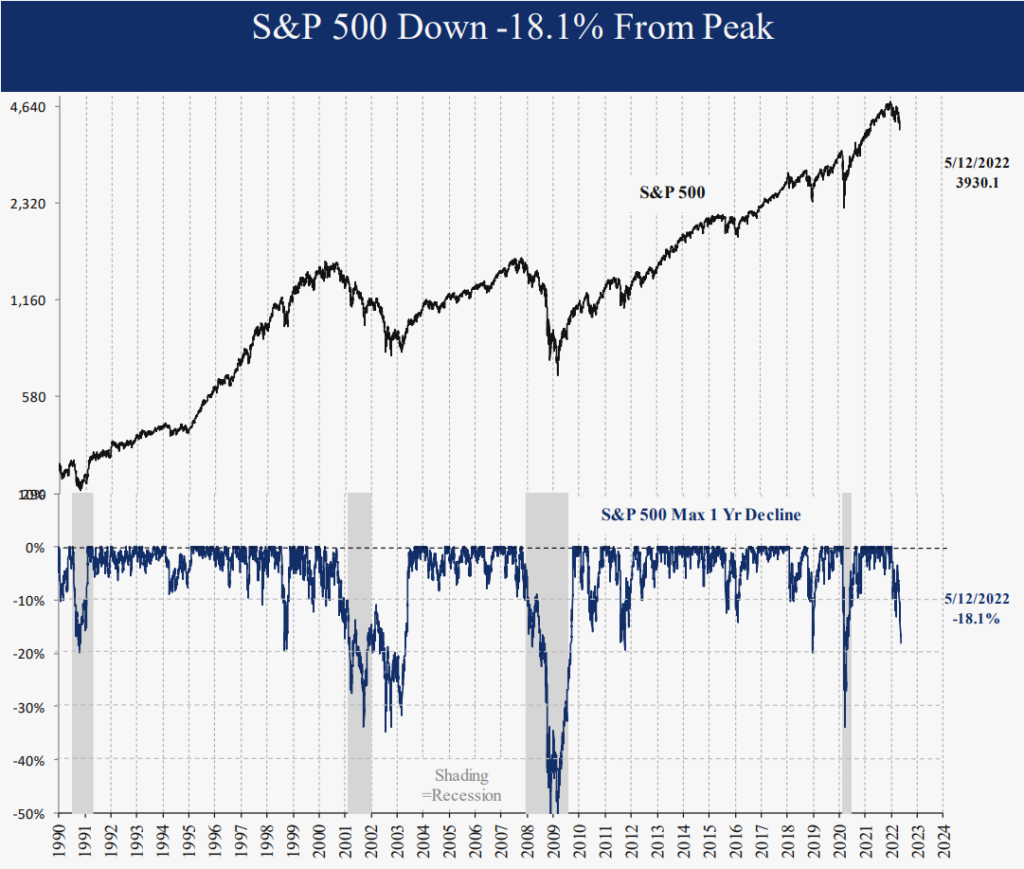
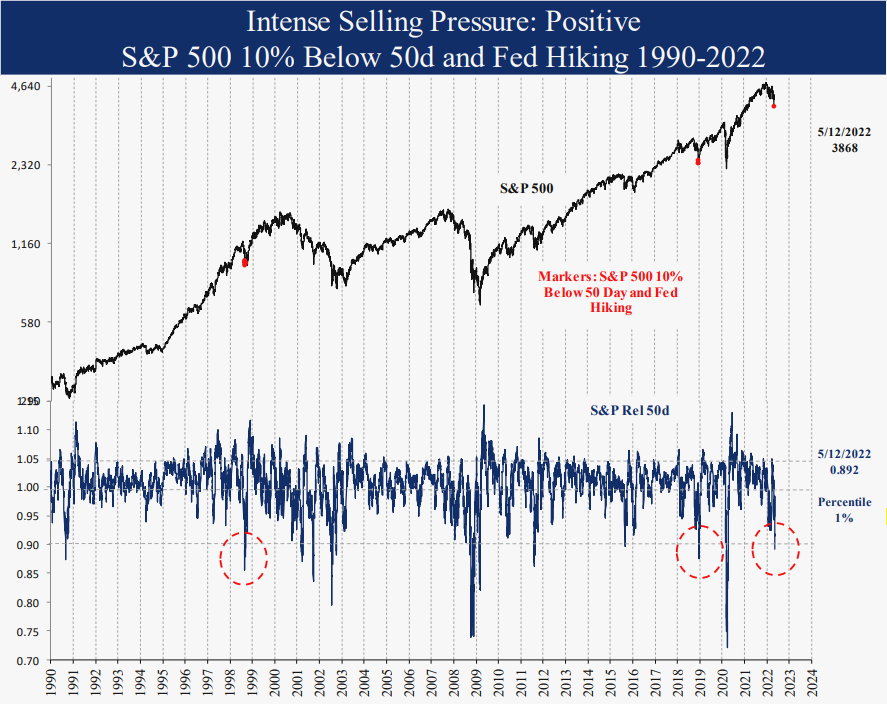
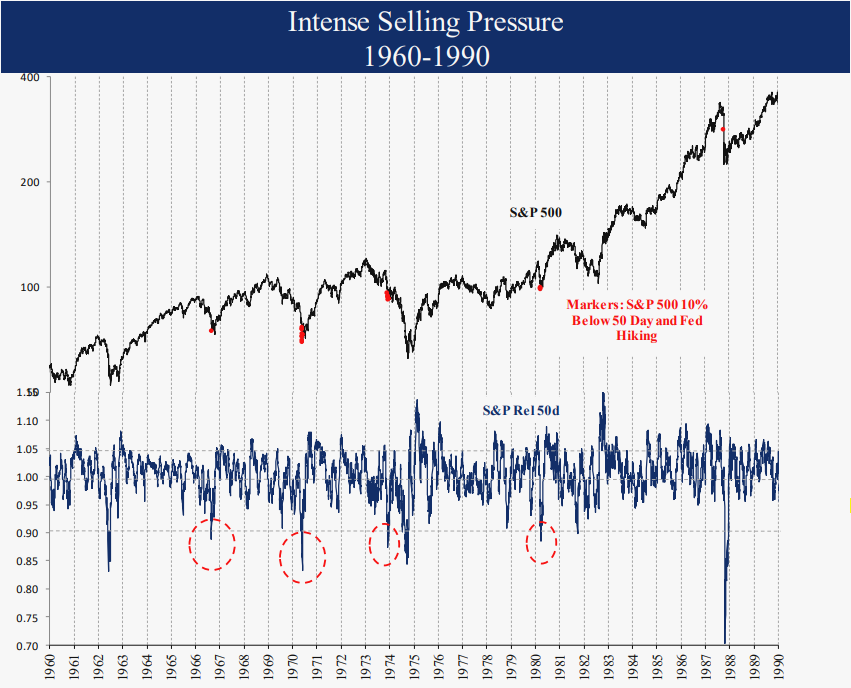
Intense Selling: Positive
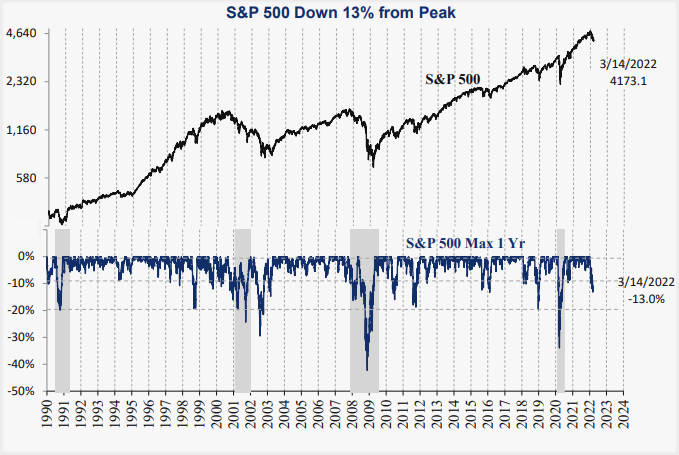
The equity index declines have been intense by any measure. The S&P 500 was down 19.5% YTD at the intraday low on 5/12/22 and down 16.7% in just 6 weeks since 4/1/22. This put the S&P 500 10% below the 50-day average, in the 1st percentile of readings since 1990. This means the market was, by this measure, weaker just 1% of the time since 1990, or more importantly, it was stronger 99% of the time. In the 8 prior cases that occurred since 1950 when the Fed was hiking rates, the S&P 500 was higher 3 months later an average of 7.8%, 3x the norm. A year later the average was 25% higher, 2.3x the norm. One significant offset is that in four of those cases the Fed reversed course and cut interest rates within a month, which is unlikely this year. But intense selling and oversold markets are often followed by reversions to the mean even during bear markets, so flexibility is important.
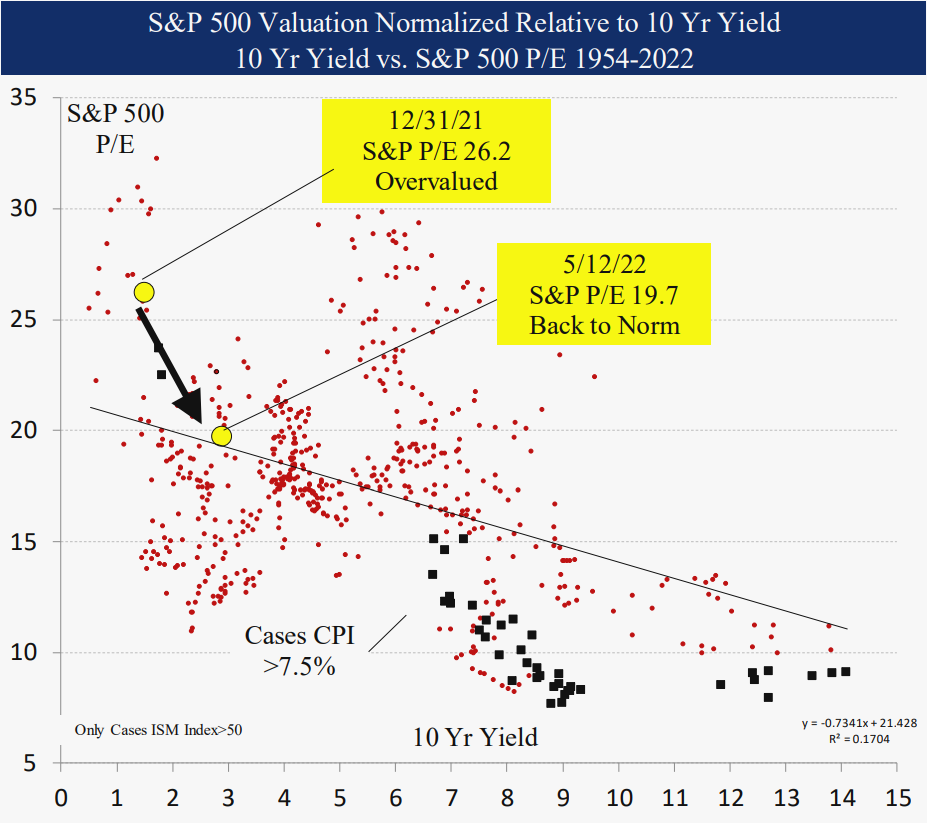
Higher Interest Rates = Lower Equities
Finance 101 teaches that a higher interest rate means a lower present value of future cash flows. Reality is more complicated as usual, since historical S&P 500 valuations compared to interest rates are certainly not a perfect fit. However, the concept is valid. The historical S&P 500 price earnings ratio norm is 21 when the 10-year Treasury yield is 1% and declines to a P/E of 10 when the 10-year yield is much higher at 15%. At year end the S&P 500 trailing price earnings ratio was 26.2, 5 points above the historical norm. By 5/12/22 the 10-year yield had doubled to 2.9% while the S&P 500 declined 18% and reduced the P/E to 19.7, close to the norm for a 3% 10-year yield. This historical relationship demonstrates why higher interest rates are a risk to equity prices and why the recent reversal in the 10-year yield, if it holds, is so important for the direction of equities. There is significant variation, but all else equal, if the 10-year Treasury yield continues higher, we should expect the S&P 500 to go lower. For now, the 10-year Treasury yield has been flat for a month, which may be enough for equities to rally.
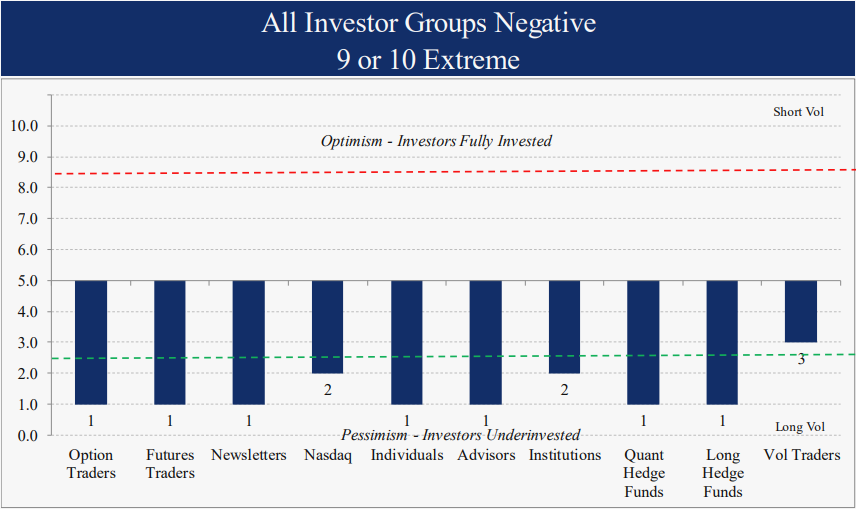
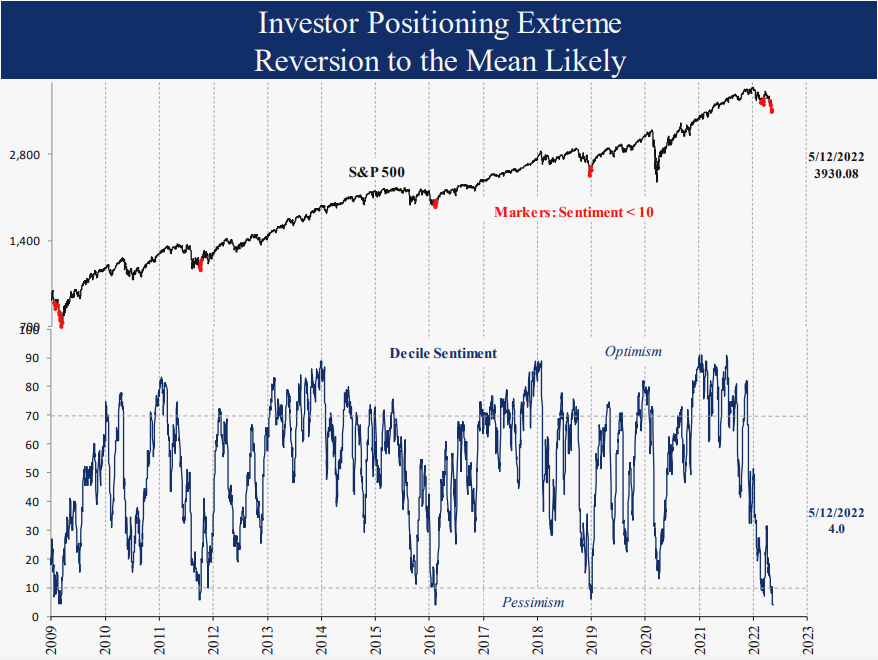
Investor Positioning Extreme
The 18% decline in the S&P 500 this year and bigger decline for other indices has resulted in extreme investor positioning as you might expect. 9 of 10 groups we follow are now in the bottom quintile of historical readings. While no one group is reliable as an indicator, when all groups reach a negative consensus like today, the low investor equity exposures and high cash levels mean a reversal in equities becomes more likely, even during bear markets.
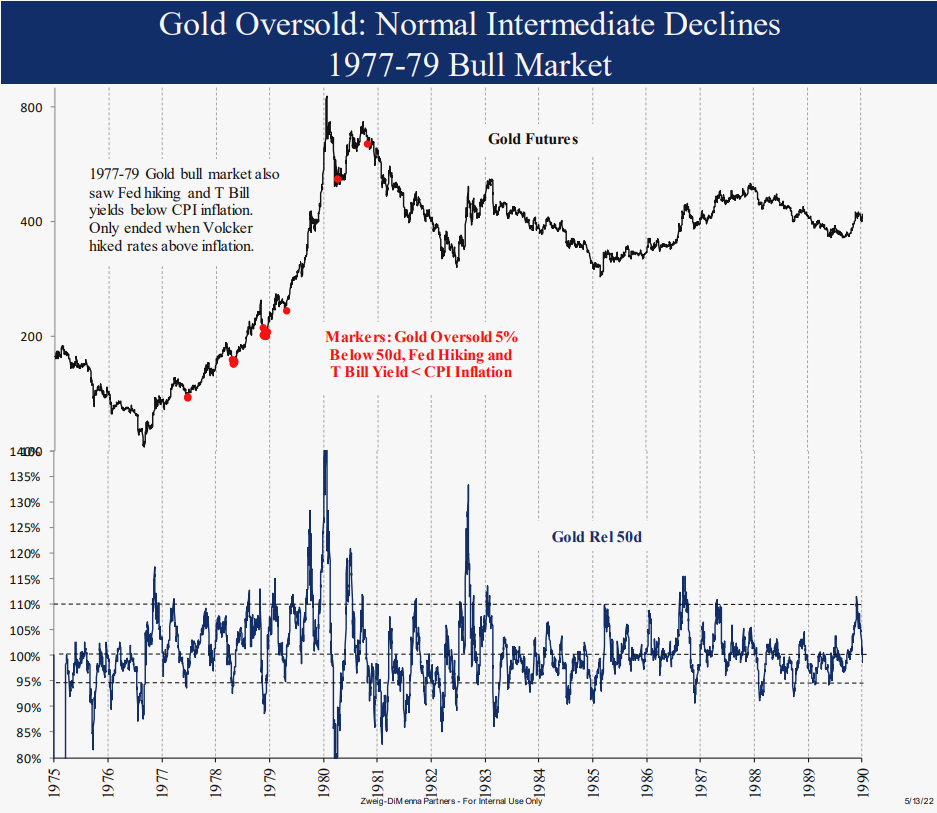
Gold Oversold: Positive
Gold has been a disappointment this year for investors, outperforming equities but seeing recent liquidation. After peaking at $2,058 up 12.4% YTD on 3/8 post the Ukraine invasion, Gold closed at $1809 on 5/13 down 1.2% YTD and down 8.5% in just one month. This puts it 6% below the 50-day average in the weakest 5% of readings since 1990. Prior cases since 2010 were typical of intermediate term lows which then reversed higher. There were also 4 cases which marked lows in the comparable 1977-79 period. These occurred early in the bull market with significant gains ahead. Today is similar to this gold bull market period when the Fed was hiking rates and inflation was above the 3-month T Bill yield, pushing investors into alternatives. Our gold rating remains a bullish 5.

Summary
Last month equity indicators were negative based on high and rising inflation, the Fed hiking rates, the rising 10-year yield and negative seasonality. This month, after the S&P 500 declined 16% in just 6 weeks, conditions have changed significantly. While the Fed is still hiking rates and seasonality remains negative through September, the combination of an extreme decline in stocks, evidence of a normal mid-cycle slow down, and extreme investor positioning were positive for equities historically, even if we remain in a bear market. We will remain flexible and continue testing conditions as they change on a daily basis. Thank you for your support and please contact us with any questions.
IMPORTANT DISCLOSURES
This review and outlook report (this “Report”) is for informational, illustration and discussion purposes only and is not intended to be, nor should it be construed as, financial, legal, tax or investment advice, of Brenton Point Wealth Advisors LLC or any of its affiliates (“Brenton Point”). This Report does not take into account the investment objectives, financial situation, restrictions, particular needs or financial, legal or tax situation of any particular person and should not be viewed as addressing any recipient’s particular investment needs. Recipients should consider the information contained in this Report as only a single factor in making an investment decision and should not rely solely on investment recommendations contained herein, if any, as a substitution for the exercise of independent judgment of the merits and risks of investments.
This material is based upon information obtained from various sources that Brenton Point believes to be reliable, but Brenton Point makes no representation or warranty with respect to the accuracy or completeness of such information. Views expressed herein are current only as of the date indicated and are subject to change without notice.
This Report contains certain forward looking statements opinions, estimates, projections, assessments and other views (collectively “Statements”). These Statements are subject to a number of assumptions, risks and uncertainties which may cause actual results, performance or achievements to be materially different from future results, performance or achievements expressed or implied by these forward looking statements and projections. Brenton Point makes no representations as to the reasonableness of such assumptions or the likelihood that such assumptions will coincide with actual events and this information should not be relied upon for that purpose. Changes in such assumptions could produce materially different results. Past performance is not a guarantee or indication of future results, and no representation or warranty, express or implied, is made regarding future performance of any financial instrument mentioned in this Report.
Any benchmark shown herein is shown for illustrative purposes only. No index benchmark is available for direct investment. It may not be possible to replicate the returns of any index, as the index may not include any trading commissions and costs or fees, may assume the reinvestment of income, and may have investment objectives, use trading strategies, or have other materials characteristics, such as credit exposure or volatility, that do not make it suitable for a particular person. This is not an offer or solicitation for the purchase or sale of any security, investment, or other product and should not be construed as such. References to specific financial instruments and to certain indices are for illustrative purposes only and provided for the purpose of making general market data available as a point of reference only; they are not intended to be, and should not be interpreted as recommendations to purchase or sell such securities. Investing in securities and other financial products entails certain risks, including the possible loss of the entire principal amount invested, as the value of investment can go down as well as up. You should obtain advice from your tax, financial, legal, and other advisors and only make investment decisions on the basis of your own objectives, experience, and resources.
Brenton Point accepts no liability for any loss (whether direct, indirect or consequential) occasioned to any person acting or refraining from action as a result of any material contained in or derived from this Report, except to the extent (but only to the extent) that such liability may not be waived, modified or limited under applicable law.
This Report may provide addresses of, or contain hyperlinks to, Internet websites. Brenton Point has not reviewed the linked Internet website of any third party and takes no responsibility for the contents thereof. Each such address or hyperlink is provided solely for your convenience and information, and the content of linked third party websites is not in any way incorporated herein. Recipients who choose to access such third-party websites or follow such hyperlinks do so at their own risk.
All marks referenced herein are the property of their respective owners. This Report is licensed for non-commercial use only, and may not be reproduced, distributed, forwarded, posted, published, transmitted, uploaded or otherwise made available to others for commercial purposes, including to individuals within an institution, without written authorization from Brenton Point.
Source of data and performance statistics: Bloomberg L.P. and Factset Research Systems Inc.
©Brenton Point Wealth Advisors LLC 2022

Michael Schaus
Director of Market Research
Michael Schaus is the Director of Market Research for Brenton Point Wealth Advisors and Zweig-DiMenna. Since joining Zweig-DiMenna in 1992, his focus has been on macroeconomic research, the analysis of…
READ MORERead Next:
Sign up!
Sign up for our monthly newsletter and get the lastest news and research from our esteemed advisors here at Brenton point. Right into your inbox!