 Client Login

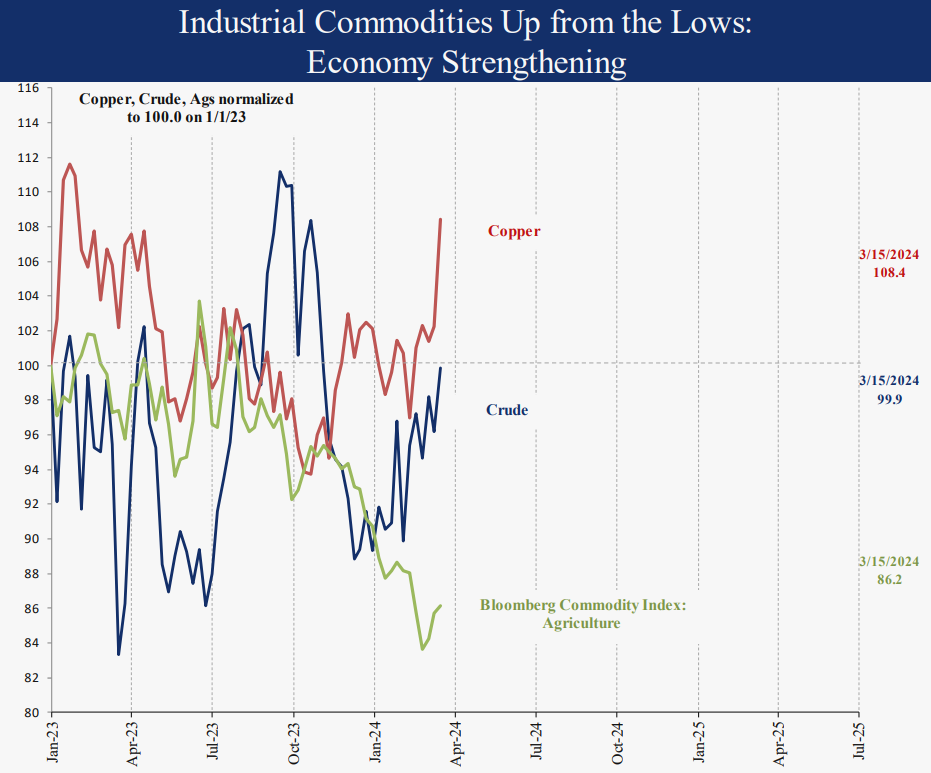
Industrial Commodities Up: Economy Strengthening
Investing Environment Review and Outlook – Volume 81
- Industrial Commodities Up: Economy Strengthening
- High U.S. Equity Valuations: Mixed Implications
- S&P 500 Last 4 Months all Higher: Bullish
Last month we discussed the CPI inflation panic, stronger economic outlook indicators and the natural gas meltdown. This month we take a look at the further improvement in the economic outlook, high U.S. equity valuations and strong equity momentum. There are implications for bonds and equities, in particular. Investor equity positioning has increased. U.S. equities, foreign-developed and emerging markets equities remain bullish 5 ratings. Gold remains a bullish 5 rating and industrial commodities remain a bullish 4 rating. Long- term bonds remain a max bearish 1 rating.
Industrial Commodities Up: Economy Strengthening
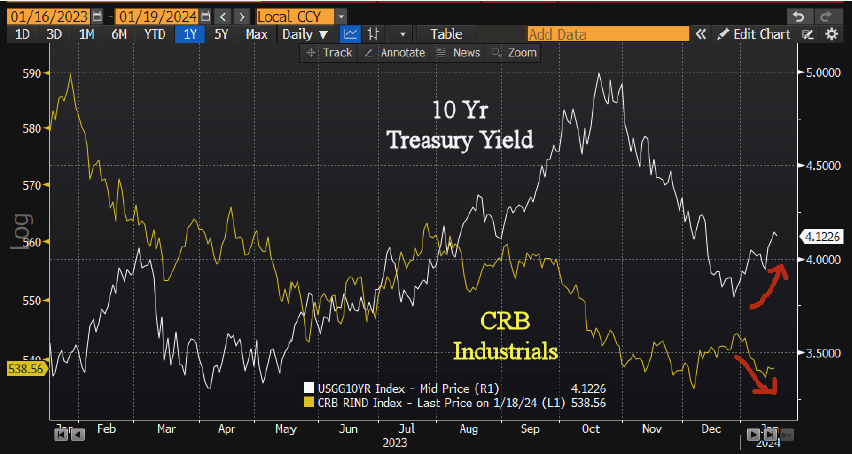
Industrial commodities like copper and crude oil are up from the lows in the last three months. As you can see, this is not yet a significant move since neither are even at the highs of the past year. However, these moves are consistent with our economic outlook model up as well to 57.3. Although still neutral, it is up from a recent low of 38 in December. This puts long-term bonds at risk with higher long-term rates likely. The Bloomberg Agriculture Commodity Index is down 14% YTD. Prices for food staples are generally more related to weather than economics, but their prices certainly affect inflation figures. Our inflation outlook indicators remain neutral as the CPI has remained in a 3.0-3.5% range for the last year.
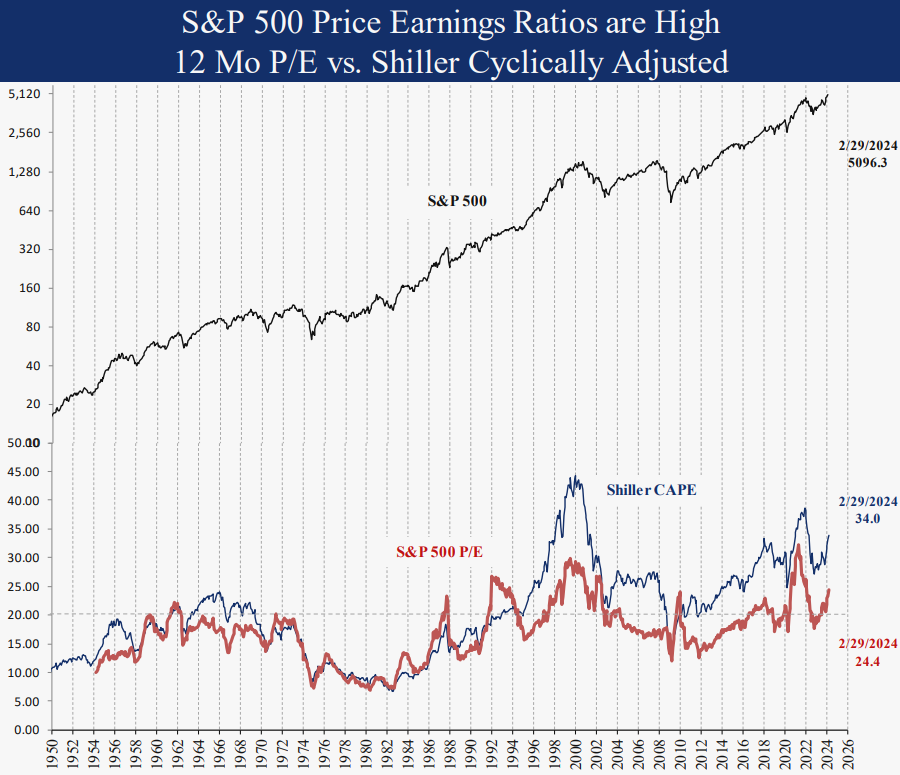
US Equity Valuations are High: Implications Mixed
U.S. equity valuations are high by most measures. The commonly cited S&P 500 price earnings ratio (P/E) at 24.4 was only higher in 2021 and 2000. This measure is not comparable historically since sector weights like technology (with high P/Es) and energy (with low P/Es) have changed dramatically over time. Our valuation model normalizes factors like P/E and price to book value (P/B) for each sector based on its own historical range. This allows for legitimate historical comparisons. The valuation model stands at 92.5, surpassing the 2021 peak valuation, making today the most expensive market in 22 years. While this seems like an obvious negative for equities, prior cases were mixed. For instance, it first reached 90 in July 1997, 2.5 years before the 2000 peak, and again in June 2021, 6 months before the 2022 peak.
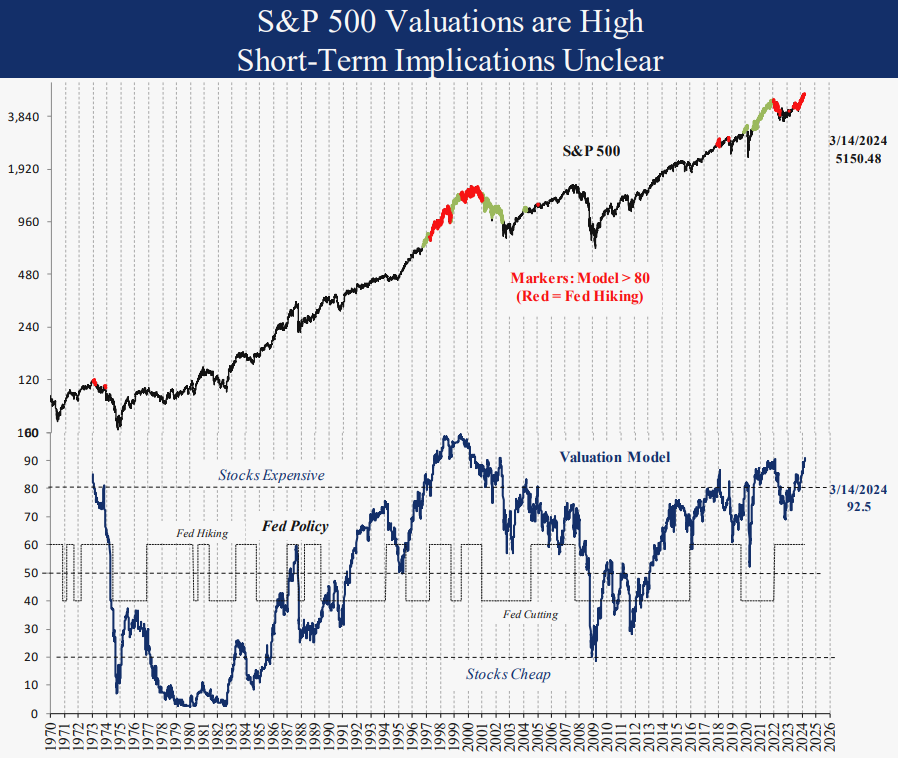
Although valuation is not predictive for short-term equity returns, the 5-10 year expected return for U.S. equities is certainly below the norm, because we cannot count on the contribution from multiple expansion as occurred since 2009. It makes the case for diversification to foreign (and cheaper) equities as well as other assets like commodities, bonds and currencies.
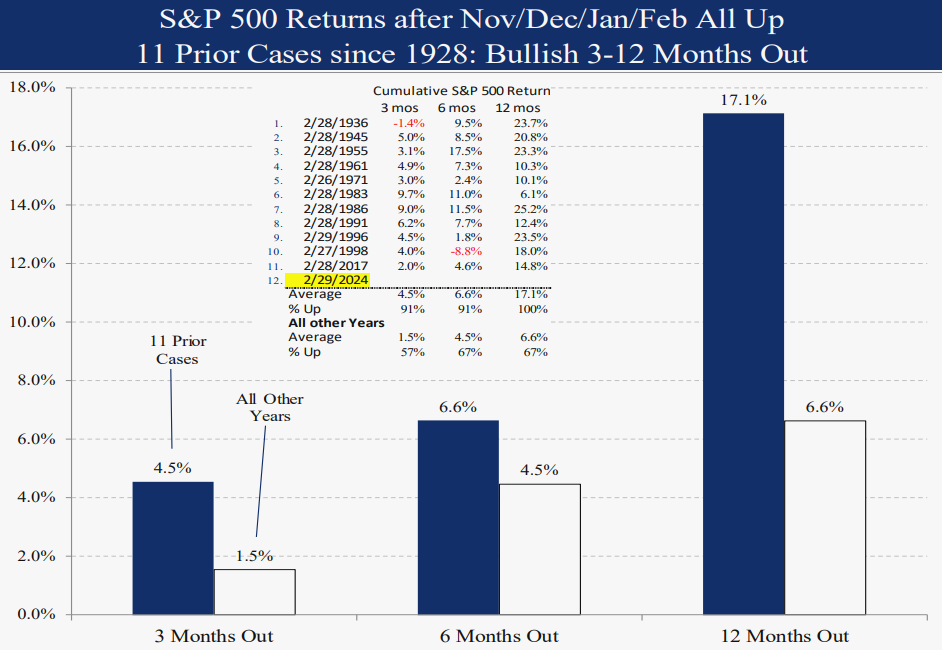
Last 4 Months All Up for S&P 500: Bullish
The S&P 500 was up in each of the last 4 months in November through February. This only occurred 11 times since 1928 (12% of the time). In this case, “the trend is your friend,” as one of our firm’s founders, Marty Zweig, used to say. 3, 6 and 12 months later, the S&P 500 was up an average of 4.5%, 6.6% and 17.1%. The norm for all other years was just 1.5%, 4.5% and 6.6% respectively. Probabilities were quite strong as well with just one case down 3 and 6 months out. No cases were lower 12 months out compared to 33% lower in all other years.
Summary
This month we discussed further improvement in our economic outlook indicators, and the bullish implications of strong momentum for the S&P 500. We are watching closely for warning signs like excessive investor positioning or a rise in inflation outlook indicators. Extreme U.S. equity valuation is a meaningful negative for long-term U.S. equity returns, which makes the case for diversification outside the U.S. and across other asset classes like (short) bonds, commodities and currencies. We will continue to watch our indicators on a daily basis and shift exposures as needed. Thank you for your support and please contact us with any questions.
IMPORTANT DISCLOSURES
This review and outlook report (this “Report”) is for informational, illustration and discussion purposes only and is not intended to be, nor should it be construed as, financial, legal, tax or investment advice, of Brenton Point Wealth Advisors LLC or any of its affiliates (“Brenton Point”). This Report does not take into account the investment objectives, financial situation, restrictions, particular needs or financial, legal or tax situation of any particular person and should not be viewed as addressing any recipient’s particular investment needs. Recipients should consider the information contained in this Report as only a single factor in making an investment decision and should not rely solely on investment recommendations contained herein, if any, as a substitution for the exercise of independent judgment of the merits and risks of investments.
This material is based upon information obtained from various sources that Brenton Point believes to be reliable, but Brenton Point makes no representation or warranty with respect to the accuracy or completeness of such information. Views expressed herein are current only as of the date indicated and are subject to change without notice.
This Report contains certain forward looking statements opinions, estimates, projections, assessments and other views (collectively “Statements”). These Statements are subject to a number of assumptions, risks and uncertainties which may cause actual results, performance or achievements to be materially different from future results, performance or achievements expressed or implied by these forward looking statements and projections. Brenton Point makes no representations as to the reasonableness of such assumptions or the likelihood that such assumptions will coincide with actual events and this information should not be relied upon for that purpose. Changes in such assumptions could produce materially different results. Past performance is not a guarantee or indication of future results, and no representation or warranty, express or implied, is made regarding future performance of any financial instrument mentioned in this Report.
Any benchmark shown herein is shown for illustrative purposes only. No index benchmark is available for direct investment. It may not be possible to replicate the returns of any index, as the index may not include any trading commissions and costs or fees, may assume the reinvestment of income, and may have investment objectives, use trading strategies, or have other materials characteristics, such as credit exposure or volatility, that do not make it suitable for a particular person. This is not an offer or solicitation for the purchase or sale of any security, investment, or other product and should not be construed as such. References to specific financial instruments and to certain indices are for illustrative purposes only and provided for the purpose of making general market data available as a point of reference only; they are not intended to be, and should not be interpreted as recommendations to purchase or sell such securities. Investing in securities and other financial products entails certain risks, including the possible loss of the entire principal amount invested, as the value of investment can go down as well as up. You should obtain advice from your tax, financial, legal, and other advisors and only make investment decisions on the basis of your own objectives, experience, and resources.
Brenton Point accepts no liability for any loss (whether direct, indirect or consequential) occasioned to any person acting or refraining from action as a result of any material contained in or derived from this Report, except to the extent (but only to the extent) that such liability may not be waived, modified or limited under applicable law.
This Report may provide addresses of, or contain hyperlinks to, Internet websites. Brenton Point has not reviewed the linked Internet website of any third party and takes no responsibility for the contents thereof. Each such address or hyperlink is provided solely for your convenience and information, and the content of linked third party websites is not in any way incorporated herein. Recipients who choose to access such third-party websites or follow such hyperlinks do so at their own risk.
All marks referenced herein are the property of their respective owners. This Report is licensed for non-commercial use only, and may not be reproduced, distributed, forwarded, posted, published, transmitted, uploaded or otherwise made available to others for commercial purposes, including to individuals within an institution, without written authorization from Brenton Point.
Source of data and performance statistics: Bloomberg L.P. and Factset Research Systems Inc.
©Brenton Point Wealth Advisors LLC 2024

Michael Schaus
Director of Market Research
Michael Schaus is the Director of Market Research for Brenton Point Wealth Advisors and Zweig-DiMenna. Since joining Zweig-DiMenna in 1992, his focus has been on macroeconomic research, the analysis of…
READ MORE
Sign up!
Sign up for our monthly newsletter and get the lastest news and research from our esteemed advisors here at Brenton point. Right into your inbox!