 Client Login

ISM Index over 55: Bullish for Equities
Our equity ratings remain a bullish 5 this month despite the media headlines on political risk, the COVID pandemic, and technology stock volatility. Recent economic releases confirm our optimistic outlook. For instance, the ISM manufacturing index and the unemployment rate both improved in August, surprising economists to the upside. This signaled that the U.S. economy has seemingly moved out of the recession recovery stage to the middle, more stable stage of the economic cycle. The ISM manufacturing index is the best coincident economic indicator, and at 56.0, the Index reached the 76th percentile of readings since 1990–well past the initial stages of the recovery.
ISM Index over 55: Bullish for Equities
There were 13 prior cases since 1950 when the ISM manufacturing index crossed up over 55, and11 of those readings marked the end of their respective recessions. It is a further indication the recession ended during the 2 nd quarter. More importantly for investors, the subsequent returns for the S&P 500 were strong. With all but one prior case, the S&P 500 was higher 3 months out, an average of 5.7% (2x the norm) and all cases were higher 6 months out, an average of 10.2% (also 2x the norm).
Chart 1: S&P 500 Returns after ISM Over 55

Chart 2: ISM Index at 56: Positive for Equities

Unemployment Rate Peaked: Positive for Stocks
Similar to the ISM Index , the unemployment rate continues to improve. The most recent reading of 8.4% for August has now reversed over half the 11.2% rise into the April peak of 14.7%. Historically, this has been a positive indicator for stocks.
Chart 3: Recession Unemployment Rate Peaks: Bullish for Equities8.4% in August vs. Peak of 14.7% in April

Typically, at this stage of the economic cycle, inflation would be reaching new highs and the Federal Reserve would be prepping markets for an initial interest rate hike. That is not the case this year, with CPI inflation at 1.0% (still 1/3 the 2018 peak), and the Federal Reserve holding interest rates at zero. Combined with $2.4 Trillion of asset purchases since March (12% of GDP) the Fed has created record liquidity. Fed Chair Powell’s speech on inflation recently marked a policy shift, ending preemptive Fed tightening to stop inflation, in order to focus on growth instead. We don’t use promises as indicators, but if true, it means a longer runway for the economic expansion and bull market.
Nasdaq 100 Index: Trend Extreme
The Nasdaq 100 index (NDX) is a good proxy for technology stocks. The top 5 stocks (Apple, Amazon, Microsoft, Facebook, and Google) make up over 50% of the index. At the 9/2/20 peak, the index was up 42.2% YTD. It was also 32% above the 200-day average, a good way to compare this year’s rally’s size and acceleration compared to prior moves. For perspective, the 32% reading we saw at the 9/2 peak ranks in the 98th percentile of moves since the index started in 1985. It is certainly extreme, and to many it is a bearish sign. However, prior cases were mixed and typical of “overbought” markets. After 2 of the prior cases, in 1991 and 1995, the NDX entered a consolidation phase, similar to our gold research findings last month. However, after the two other cases, in 1999 and 2000, the NDX continued sharply higher, peaking over 50% above the 200-day average. A consolidation phase is probably most likely–a period which might frustrate both bulls and bears, but also set up for the next leg higher.
Chart 4: NDX 32% Over 200 Day: 98th Percentile: 1986 – 2020

Investor Positioning Still Mixed; Options Extreme
There is a popular story about Softbank option buying contributing to the recent technology rally, and perhaps to the recent decline as well. The put/call ratio is the lowest in 8 years, showing that option traders as a group are certainly positioned long, since call volume is higher than put volume. Low readings in this ratio are negative for equities and are always reason for caution. However, “investor positioning as an indicator” is most meaningful when all investor groups are on one side of the market, long or short. For now, it is a mixed picture, since individuals and institutions have low equity exposure, which offsets others like options investors on the long side.
Chart 5: Equity Put/Call Ratio Low Extreme: 2000 – 2020

Summary
The unexpectedly strong economy combined with a committed loose Federal Reserve is a potent combination, supporting our bullish 5 ranking for U.S. equities. Although investors are most concerned with economic weakness, the COVID-19 pandemic, and politics, further economic strength will be a bigger risk for equities at some point. That will bring higher confidence and eventually inflation, higher interest rates, and a reversal in Fed Policy. Until then, 6-10% declines should be expected, even in the best of conditions. Other asset rankings were unchanged this month, with bullish 5’s for foreign developed and emerging market equites, commodities and gold. Long-term bonds are still a cautious 1 ranking due to the risk that longer-term rates will move higher. We will continue monitoring all our indicators as conditions change. Thank you for your support and please contact your advisor with any questions.
IMPORTANT DISCLOSURES
This review and outlook report (this “Report”) is for informational, illustration and discussion purposes only and is not intended to be, nor should it be construed as, financial, legal, tax or investment advice, of Brenton Point Wealth Advisors LLC or any of its affiliates (“Brenton Point”). This Report does not take into account the investment objectives, financial situation, restrictions, particular needs or financial, legal or tax situation of any particular person and should not be viewed as addressing any recipient’s particular investment needs. Recipients should consider the information contained in this Report as only a single factor in making an investment decision and should not rely solely on investment recommendations contained herein, if any, as a substitution for the exercise of independent judgment of the merits and risks of investments.
This material is based upon information obtained from various sources that Brenton Point believes to be reliable, but Brenton Point makes no representation or warranty with respect to the accuracy or completeness of such information. Views expressed herein are current only as of the date indicated and are subject to change without notice.
This Report contains certain forward looking statements opinions, estimates, projections, assessments and other views (collectively “Statements”). These Statements are subject to a number of assumptions, risks and uncertainties which may cause actual results, performance or achievements to be materially different from future results, performance or achievements expressed or implied by these forward looking statements and projections. Brenton Point makes no representations as to the reasonableness of such assumptions or the likelihood that such assumptions will coincide with actual events and this information should not be relied upon for that purpose. Changes in such assumptions could produce materially different results. Past performance is not a guarantee or indication of future results, and no representation or warranty, express or implied, is made regarding future performance of any financial instrument mentioned in this Report.
Any benchmark shown herein is shown for illustrative purposes only. No index benchmark is available for direct investment. It may not be possible to replicate the returns of any index, as the index may not include any trading commissions and costs or fees, may assume the reinvestment of income, and may have investment objectives, use trading strategies, or have other materials characteristics, such as credit exposure or volatility, that do not make it suitable for a particular person. This is not an offer or solicitation for the purchase or sale of any security, investment, or other product and should not be construed as such. References to specific financial instruments and to certain indices are for illustrative purposes only and provided for the purpose of making general market data available as a point of reference only; they are not intended to be, and should not be interpreted as recommendations to purchase or sell such securities. Investing in securities and other financial products entails certain risks, including the possible loss of the entire principal amount invested, as the value of investment can go down as well as up. You should obtain advice from your tax, financial, legal, and other advisors and only make investment decisions on the basis of your own objectives, experience, and resources.
Brenton Point accepts no liability for any loss (whether direct, indirect or consequential) occasioned to any person acting or refraining from action as a result of any material contained in or derived from this Report, except to the extent (but only to the extent) that such liability may not be waived, modified or limited under applicable law.
This Report may provide addresses of, or contain hyperlinks to, Internet websites. Brenton Point has not reviewed the linked Internet website of any third party and takes no responsibility for the contents thereof. Each such address or hyperlink is provided solely for your convenience and information, and the content of linked third party websites is not in any way incorporated herein. Recipients who choose to access such third-party websites or follow such hyperlinks do so at their own risk.
All marks referenced herein are the property of their respective owners. This Report is licensed for non-commercial use only, and may not be reproduced, distributed, forwarded, posted, published, transmitted, uploaded or otherwise made available to others for commercial purposes, including to individuals within an institution, without written authorization from Brenton Point.
Source of data and performance statistics: Bloomberg L.P. and Factset Research Systems Inc.
©Brenton Point Wealth Advisors LLC 2020

Michael Schaus
Director of Market Research
Michael Schaus is the Director of Market Research for Brenton Point Wealth Advisors and Zweig-DiMenna. Since joining Zweig-DiMenna in 1992, his focus has been on macroeconomic research, the analysis of…
READ MORE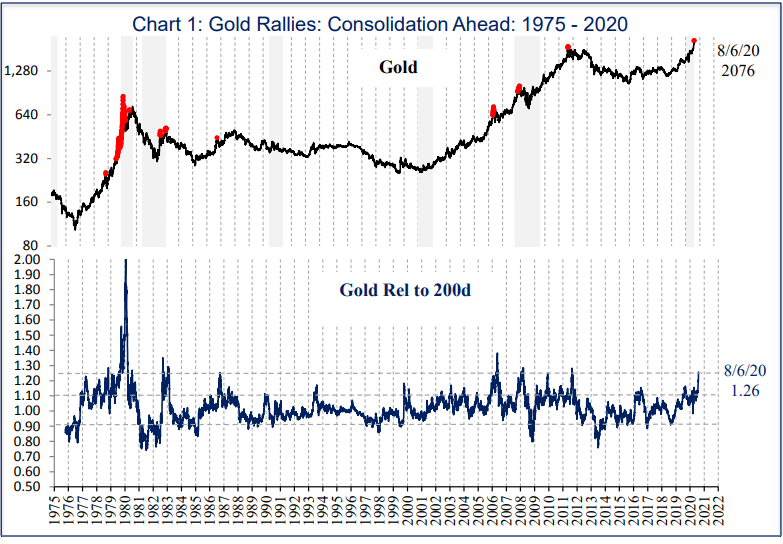

Sign up!
Sign up for our monthly newsletter and get the lastest news and research from our esteemed advisors here at Brenton point. Right into your inbox!