 Client Login

Weak Dollar: Bullish for S&P 500 and Emerging Markets
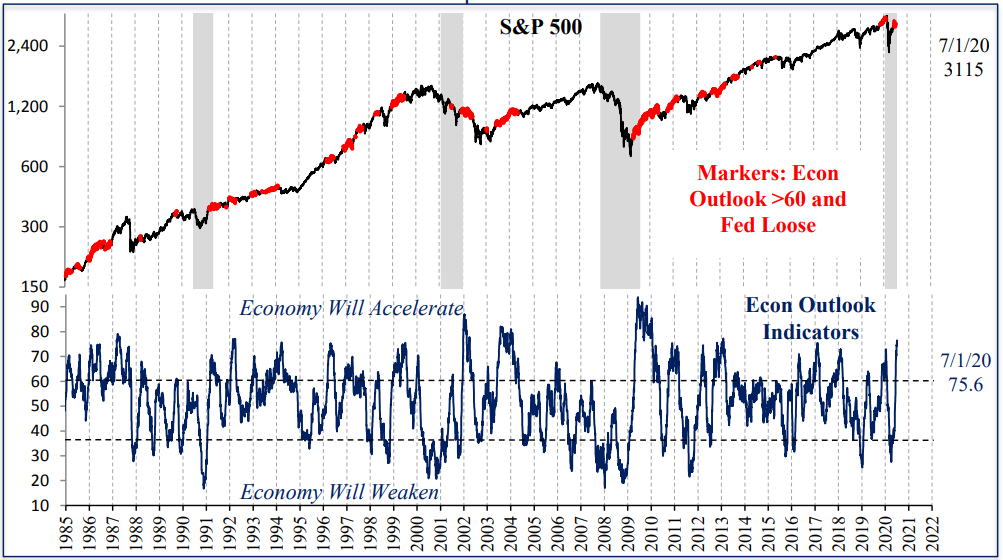
Although the tragic COVID-19 pandemic still dominates most of our lives, the bullish Goldilocks economic conditions we discussed in July have been corroborated by subsequent reports like the higher ISM manufacturing index and lower unemployment rate, which support our optimistic view. Although the one of a kind pandemic recession still adds uncertainty to any forecast, our positive economic outlook indicators, evidence of moderate growth, record high savings accounts, and a continued loose Federal Reserve give us conviction that the economic recovery and bull market will continue. Our equity, commodities and gold ratings remain bullish 5’s while long-term bonds remain a cautious 1. This month we discuss the implications of the extreme gold rally, the dollar decline and presidential election years.
Extreme Gold Move: Positive for Stocks/Risk for Gold Volatility
Long-term indicators remain positive for gold, which rallied more than 32% in less than 5 months, to $2076, a new all-time high. Economic indicators for gold are positive with negative real interest rates, combined with an extremely loose Federal Reserve boosting the money supply by over 25%. Historically gold returns were positive in August and September, averaging 3.2% return since 2000 (19.3% annualized). However, the sharp run up is reason for caution in the short term. Gold is 26% above its 200-day average, the 98th percentile of readings since 1975. In the 11 prior cases since 1975, the next 10% move in gold was down in 9 of those. Two months out the average return was -5%, with 9 of the 11 cases lower. On average, prior cases consolidated for 1-2 months, which is a reasonable expectation even with all the positive factors. 1979 was a huge outlier when gold rallied to 2x the 200-day average. Today that would be another 60% rally to $3,300. Inflation then was 10% on the way to 14.7% by 1980, so conditions were different. Despite the higher odds for near term volatility, we are maintaining our bullish 5 rating on gold, since the gold bull market should continue until the Fed shifts policy and hikes rates as Volcker did in 1979.
Chart 1: Gold Rallies: Consolidation Ahead: 1975 – 2020

Chart 2: Gold 100% Above 200 Day Average in 1979: 1975 – 1990

Although the extreme gold move is cautionary for gold returns, these same signals were positive for equities. The next 10% move in the S&P 500 was higher in 10 of the 11 cases, and the average return 3 months out was 7.4%, 30% annualized, or 3x the norm. It likely signals that liquidity is strong and the Fed is loose, some of the best conditions for equities.
Chart 3: Gold Rallies: Positive for S&P 500 : 1975 – 2020

Gold rallies like this were NOT predictive for inflation as many investors assume. Many remember the 1979-80 gold and inflation run-up, but since then there have been 6 gold rallies that were not followed by any sustained inflation. We are watching our inflation outlook model closely, but it remains neutral. Generally inflation is a lagging indicator following strong economic activity, so it is more likely to follow sustained economic strength and higher consumer confidence later in the cycle.
Chart 4: Gold Rallies: Mixed as Inflation Predictor : 1975 – 2020

Foreign Economies: Synchronized Global Rebound
In each of the last 3 months, 87%, 93% and 85% of foreign country Purchasing Managers Indices have been higher, the strongest synchronized move since 2009. These are the best coincident economic indicators for any country since they are released without a time lag and are not revised. It means this is not just a U.S. rebound, but the strongest world economic turn since 2009. Typically investors are too focused on domestic issues like politics that produce the most headlines, but the context of a much wider global economic rebound is critical in weighing the importance of other issues.
Chart 5: Foreign Market PMI’s Level: July 2020

Chart 6: 85% of Country PMI M/M UP: Positive for U.S. Economy

Presidential Election Years: Mixed Returns in September and October
According to an ISI survey, the election is the top concern for investors, moving ahead of the COVID-19 pandemic for the first time this week. In prior presidential election years since 1950, September and October returns combined averaged -0.3%, weaker than the 1.3% return in all other years. The weakness is possibly due to heightened rhetoric adding perceived investment uncertainty as the election draws closer. However, after the election, November and December returns were strong despite a wide combination of outcomes, showing that political risks are probably lower than investors anticipate. November and December returns combined averaged 3.2% which is 19.2% annualized. This is slightly weaker than all other years at 3.8% but in election years 88% were higher, better than the 79% for all other years. The only two down election years for November and December combined were 2000 and 2008, and politics was not the issue for either one.
S&P 500 Returns in YEAR 4 of Presidential Cycle Mixed in Sep/Oct, Bullish in Nov/Dec

Weak Dollar: Bullish for S&P 500 and Emerging Markets
The Dollar Index is down 10% from the March peak. The falling dollar is a small net positive for the S&P 500 with 14.9% return when the dollar is falling vs. norm of 11.6%. The dollar trend is more significant for emerging markets equities which returned 18.0% when the dollar was trending down vs. -1.3% when the dollar was trending up. This dollar decline could be the catalyst for emerging markets to move out of their sideways range since 2007. Valuations remain at a discount to the U.S. and investors’ positioning is low, providing more upside potential as allocations are increased.
Chart 7: Weak Dollar Bullish for Emerging Markets: 1988 – 2020

Investor Positioning: Long but not Extreme
U.S. equity investor positioning remains long but not yet extreme. Option traders, newsletters and advisors remain the most bullish while individuals and institutions are the most negative on the market, and likely have the lowest net exposure. For now, positioning is not a relevant factor in our positive equity outlook.
Chart 8: Equity Investor Positioning is Mixed: 10 Groups

Summary
Despite the COVID-19 pandemic, recent data points confirm the 2020 recovery continues, with bullish conditions for equities, commodities and gold. Although gold may see a period of consolidation after this extreme move to the upside, the next big move is likely higher, at least until the Federal Reserve tightens monetary policy. Similarly, for U.S. equities, presidential campaign rhetoric will likely dampen enthusiasm for equities in the coming months, but that process should set up the next leg higher. As always, we will continue testing assumptions and monitoring our indicators closely for changes. Thank you for your support and please contact your advisor with any questions.
IMPORTANT DISCLOSURES
This review and outlook report (this “Report”) is for informational, illustration and discussion purposes only and is not intended to be, nor should it be construed as, financial, legal, tax or investment advice, of Brenton Point Wealth Advisors LLC or any of its affiliates (“Brenton Point”). This Report does not take into account the investment objectives, financial situation, restrictions, particular needs or financial, legal or tax situation of any particular person and should not be viewed as addressing any recipient’s particular investment needs. Recipients should consider the information contained in this Report as only a single factor in making an investment decision and should not rely solely on investment recommendations contained herein, if any, as a substitution for the exercise of independent judgment of the merits and risks of investments.
This material is based upon information obtained from various sources that Brenton Point believes to be reliable, but Brenton Point makes no representation or warranty with respect to the accuracy or completeness of such information. Views expressed herein are current only as of the date indicated and are subject to change without notice.
This Report contains certain forward looking statements opinions, estimates, projections, assessments and other views (collectively “Statements”). These Statements are subject to a number of assumptions, risks and uncertainties which may cause actual results, performance or achievements to be materially different from future results, performance or achievements expressed or implied by these forward looking statements and projections. Brenton Point makes no representations as to the reasonableness of such assumptions or the likelihood that such assumptions will coincide with actual events and this information should not be relied upon for that purpose. Changes in such assumptions could produce materially different results. Past performance is not a guarantee or indication of future results, and no representation or warranty, express or implied, is made regarding future performance of any financial instrument mentioned in this Report.
Any benchmark shown herein is shown for illustrative purposes only. No index benchmark is available for direct investment. It may not be possible to replicate the returns of any index, as the index may not include any trading commissions and costs or fees, may assume the reinvestment of income, and may have investment objectives, use trading strategies, or have other materials characteristics, such as credit exposure or volatility, that do not make it suitable for a particular person. This is not an offer or solicitation for the purchase or sale of any security, investment, or other product and should not be construed as such. References to specific financial instruments and to certain indices are for illustrative purposes only and provided for the purpose of making general market data available as a point of reference only; they are not intended to be, and should not be interpreted as recommendations to purchase or sell such securities. Investing in securities and other financial products entails certain risks, including the possible loss of the entire principal amount invested, as the value of investment can go down as well as up. You should obtain advice from your tax, financial, legal, and other advisors and only make investment decisions on the basis of your own objectives, experience, and resources.
Brenton Point accepts no liability for any loss (whether direct, indirect or consequential) occasioned to any person acting or refraining from action as a result of any material contained in or derived from this Report, except to the extent (but only to the extent) that such liability may not be waived, modified or limited under applicable law.
This Report may provide addresses of, or contain hyperlinks to, Internet websites. Brenton Point has not reviewed the linked Internet website of any third party and takes no responsibility for the contents thereof. Each such address or hyperlink is provided solely for your convenience and information, and the content of linked third party websites is not in any way incorporated herein. Recipients who choose to access such third-party websites or follow such hyperlinks do so at their own risk.
All marks referenced herein are the property of their respective owners. This Report is licensed for non-commercial use only, and may not be reproduced, distributed, forwarded, posted, published, transmitted, uploaded or otherwise made available to others for commercial purposes, including to individuals within an institution, without written authorization from Brenton Point.
Source of data and performance statistics: Bloomberg L.P. and Factset Research Systems Inc.
©Brenton Point Wealth Advisors LLC 2020

Michael Schaus
Director of Market Research
Michael Schaus is the Director of Market Research for Brenton Point Wealth Advisors and Zweig-DiMenna. Since joining Zweig-DiMenna in 1992, his focus has been on macroeconomic research, the analysis of…
READ MORE
Sign up!
Sign up for our monthly newsletter and get the lastest news and research from our esteemed advisors here at Brenton point. Right into your inbox!