 Client Login

Markets
Although virus cases are still accelerating in the US, market volatility remains high, and economic releases like unemployment claims are showing severe economic weakness, our indicators improved this week with the rebound in equities, the Federal Reserve launching unprecedented stimulus, and Congress passing a stimulus bill. Combined, the Fed programs and fiscal spending are over 18% of GDP reflecting a massive effort on the part of the government to try and contain the economic effects of the virus.
Markets
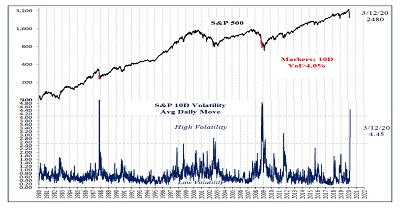
In our last note we wrote that despite the volatility and 30% decline in stocks, we retained our neutral rating for equities. We thought at some point investors would see past the virus-induced economic shutdown to an economic recovery. This week that may have happened. The S&P 500 rallied 17.5%, in just three days, from Tuesday to Thursday. Incredibly, they were the first consecutive days of gains since the decline started in February. The move retraced 1/3 of the full decline since February.
These kind of sharp “relief” rallies are typical in past bear markets and especially in past crashes. In the short-term volatility will likely remain. For instance, in the 9 prior cases since 1928, returns 1 month later had mixed results. However, longer term the outlook is better. 6 months after these cases the median return was +16.7%, with 7 of 9 cases higher.

Federal Reserve: All In
On Monday morning the Fed announced an unlimited quantitative easing program. Specifically, they set up programs with unlimited funds to support commercial real estate, consumers, small and medium businesses, corporate bonds, consumer credit, and municipal finance. For investors worried the Fed had no “bullets” left, Fed Chairman Powell clarified in a Today Show interview Thursday morning saying “We are not going to run out of ammunition. That is not going to happen.”
At $517 billion in the last 4 weeks alone, the Fed program is unprecedented in scope and size. For comparison in scale, the Fed was buying $200 billion per month in March 2009, which was enough to mark the low in stocks. Fed purchases could reach 9% of GDP. “Don’t fight the Fed” applies today more than ever.

Fiscal Stimulus
On top of the massive Fed move, Congress passed a $2 Trillion spending bill, also 9% of GDP. This aid will help individuals, businesses, and state and local governments. For comparison, the 2008 spending bill was just $800 billion (5.5% of GDP). This aid will help dampen the economic damage in the 2nd quarter, where estimates range from -8% to -30%.

Raising Emerging Markets to Bullish 5 Rating
We are raising emerging markets equities to a bullish 5 rating based on the extreme valuation on both an absolute and relative basis. The Shiller P/E ratio for emerging markets is just 10x, lower than any prior time since 1995, even during the 2008 financial crisis. This P/E averages earnings over 10 years to smooth out cycle volatility. We cannot predict the low, but for long-term investors, this is a valuation extreme with the highest expected long-term returns of any area in the world.
The dollar has a strong negative correlation to emerging markets returns. For instance, in 2008 after the last comparable Fed actions, the dollar fell 13% in 2009 and the MSCI emerging markets index rallied 100% from the low. When the Fed buys for their balance sheet, they are directly and rapidly increasing the supply of dollars, so it is logical the dollar would fall in value. This pattern may be repeating again this year, with the dollar down 4% in the last week since the Fed announced QE “unlimited.”

In summary, we are retaining our neutral 3 rating for U.S. and developed equities due to the indicator improvement, and we may raise the ratings if conditions improve further. In 3 of the 4 prior largest quarterly GDP declines, the S&P declines were less than the 34% the S&P declined already this year. In other words, the stock market may have already priced in the economic weakness we will see ahead.
Thank you for your support and please contact your advisor with any questions.
IMPORTANT DISCLOSURES
This review and outlook report (this “Report”) is for informational, illustration and discussion purposes only and is not intended to be, nor should it be construed as, financial, legal, tax or investment advice, of Brenton Point Wealth Advisors LLC or any of its affiliates (“Brenton Point”). This Report does not take into account the investment objectives, financial situation, restrictions, particular needs or financial, legal or tax situation of any particular person and should not be viewed as addressing any recipient’s particular investment needs. Recipients should consider the information contained in this Report as only a single factor in making an investment decision and should not rely solely on investment recommendations contained herein, if any, as a substitution for the exercise of independent judgment of the merits and risks of investments.
This material is based upon information obtained from various sources that Brenton Point believes to be reliable, but Brenton Point makes no representation or warranty with respect to the accuracy or completeness of such information. Views expressed herein are current only as of the date indicated and are subject to change without notice.
This Report contains certain forward looking statements opinions, estimates, projections, assessments and other views (collectively “Statements”). These Statements are subject to a number of assumptions, risks and uncertainties which may cause actual results, performance or achievements to be materially different from future results, performance or achievements expressed or implied by these forward looking statements and projections. Brenton Point makes no representations as to the reasonableness of such assumptions or the likelihood that such assumptions will coincide with actual events and this information should not be relied upon for that purpose. Changes in such assumptions could produce materially different results. Past performance is not a guarantee or indication of future results, and no representation or warranty, express or implied, is made regarding future performance of any financial instrument mentioned in this Report.
Any benchmark shown herein is shown for illustrative purposes only. No index benchmark is available for direct investment. It may not be possible to replicate the returns of any index, as the index may not include any trading commissions and costs or fees, may assume the reinvestment of income, and may have investment objectives, use trading strategies, or have other materials characteristics, such as credit exposure or volatility, that do not make it suitable for a particular person. This is not an offer or solicitation for the purchase or sale of any security, investment, or other product and should not be construed as such. References to specific financial instruments and to certain indices are for illustrative purposes only and provided for the purpose of making general market data available as a point of reference only; they are not intended to be, and should not be interpreted as recommendations to purchase or sell such securities. Investing in securities and other financial products entails certain risks, including the possible loss of the entire principal amount invested, as the value of investment can go down as well as up. You should obtain advice from your tax, financial, legal, and other advisors and only make investment decisions on the basis of your own objectives, experience, and resources.
Brenton Point accepts no liability for any loss (whether direct, indirect or consequential) occasioned to any person acting or refraining from action as a result of any material contained in or derived from this Report, except to the extent (but only to the extent) that such liability may not be waived, modified or limited under applicable law.
This Report may provide addresses of, or contain hyperlinks to, Internet websites. Brenton Point has not reviewed the linked Internet website of any third party and takes no responsibility for the contents thereof. Each such address or hyperlink is provided solely for your convenience and information, and the content of linked third party websites is not in any way incorporated herein. Recipients who choose to access such third-party websites or follow such hyperlinks do so at their own risk.
All marks referenced herein are the property of their respective owners. This Report is licensed for non-commercial use only, and may not be reproduced, distributed, forwarded, posted, published, transmitted, uploaded or otherwise made available to others for commercial purposes, including to individuals within an institution, without written authorization from Brenton Point.
Source of data and performance statistics: Bloomberg L.P. and Factset Research Systems Inc.
©Brenton Point Wealth Advisors LLC 2020

Michael Schaus
Director of Market Research
Michael Schaus is the Director of Market Research for Brenton Point Wealth Advisors and Zweig-DiMenna. Since joining Zweig-DiMenna in 1992, his focus has been on macroeconomic research, the analysis of…
READ MORE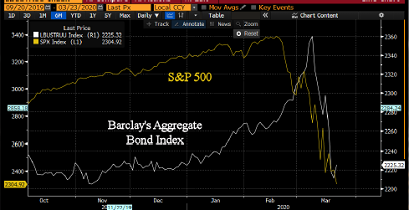
Sign up!
Sign up for our monthly newsletter and get the lastest news and research from our esteemed advisors here at Brenton point. Right into your inbox!