 Client Login

Mid-cycle Slowdown
Investing Environment Review and Outlook – Volume 51
Mid-cycle Slowdown
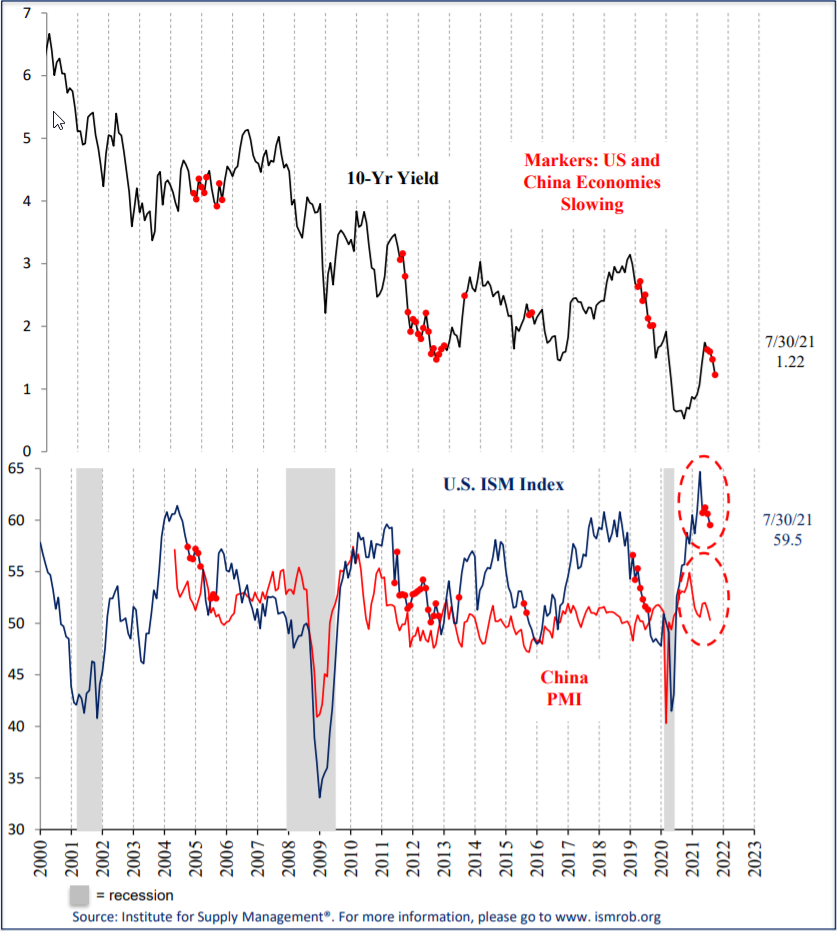
The drop in the 10-year Treasury yield to 1.2% this month confused many investors also seeing 5.4% inflation and 6.5% Q2 GDP growth. From Bloomberg news on 8/4/21: “Bearish Citi strategists point to technical factors behind the recent drop in yields, such as the unwinding of short positions and supply dynamics.” (Source: Bloomberg, “Citi’s Levkovitz is Still Bearish On Stocks But Likes Cyclicals”, 8/4/21 This review and outlook report by Brenton Point Wealth Advisors LLC represents our views and beliefs regarding the current market outlook. Please also read the important disclosures at the end of this report.)
Last month we discussed a possible transition of the U.S. and world economy out of the boom phase. Weaker economic indicators since then signified a typical mid-cycle slowdown is underway despite the strong Q2 GDP and July employment reports, both lagging indicators, and making a lower 10-year yield more logical in retrospect. This month we discuss historical cases and the implications for assets. We also review the recent gold price decline. Asset ratings were unchanged this month. The U.S. equities rating remains a neutral 3. Foreign developed and Emerging Markets remain a bullish 4. Bonds and commodities remain a neutral 3 rating and gold remains a bullish 5.
US and China Synchronized Deceleration
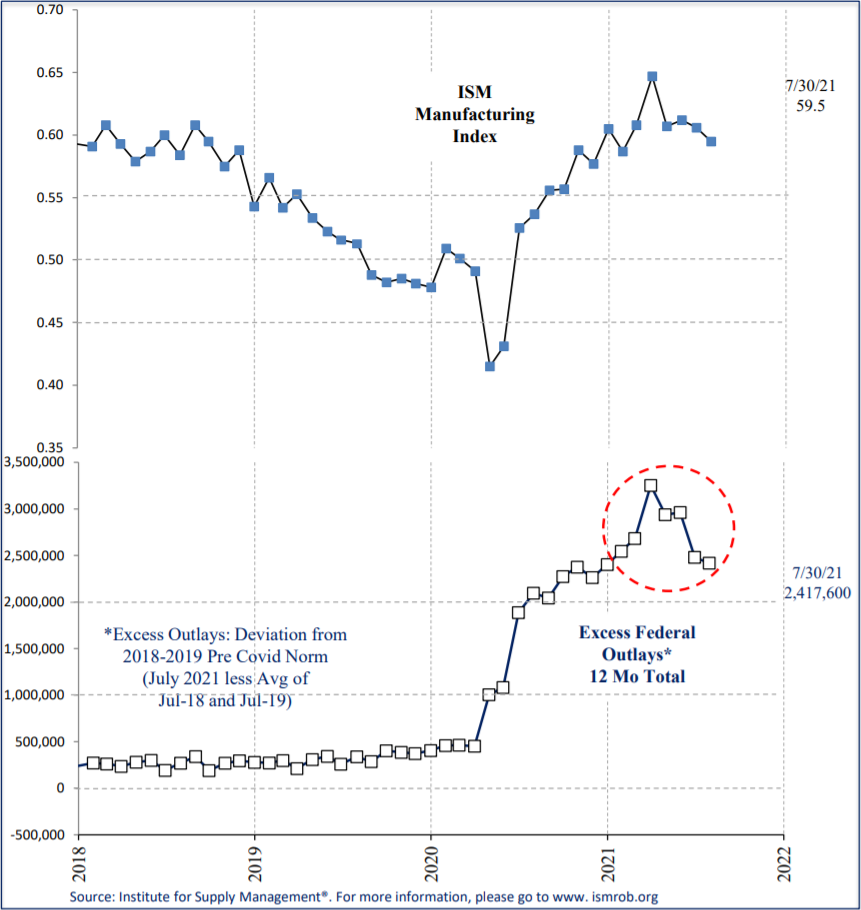
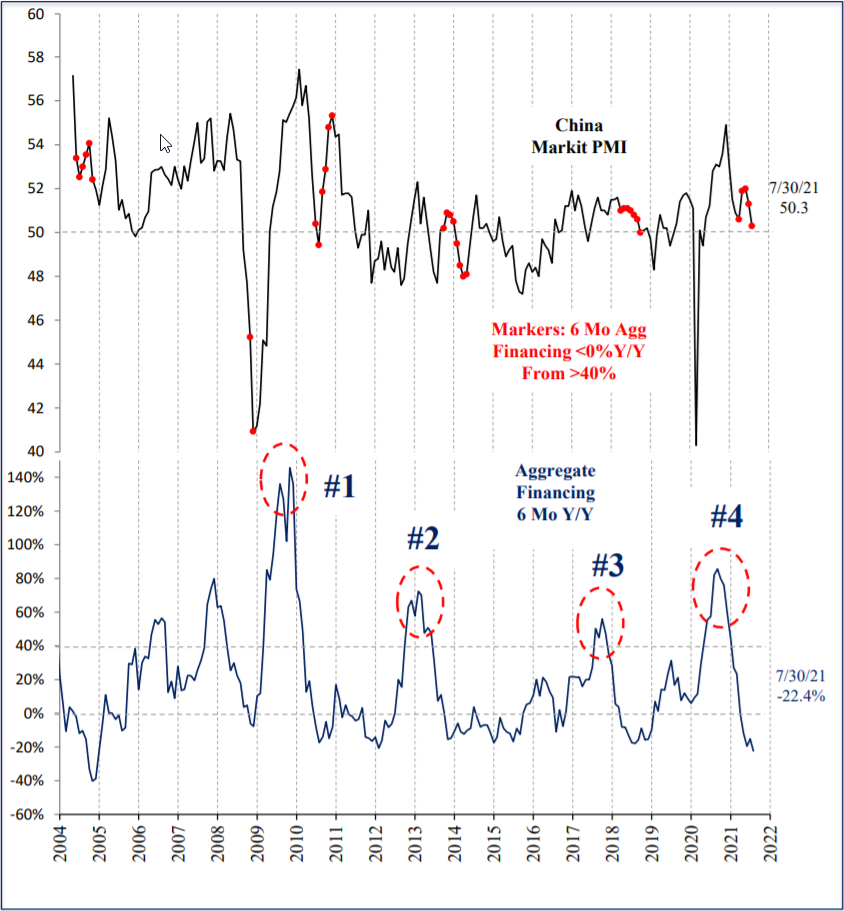
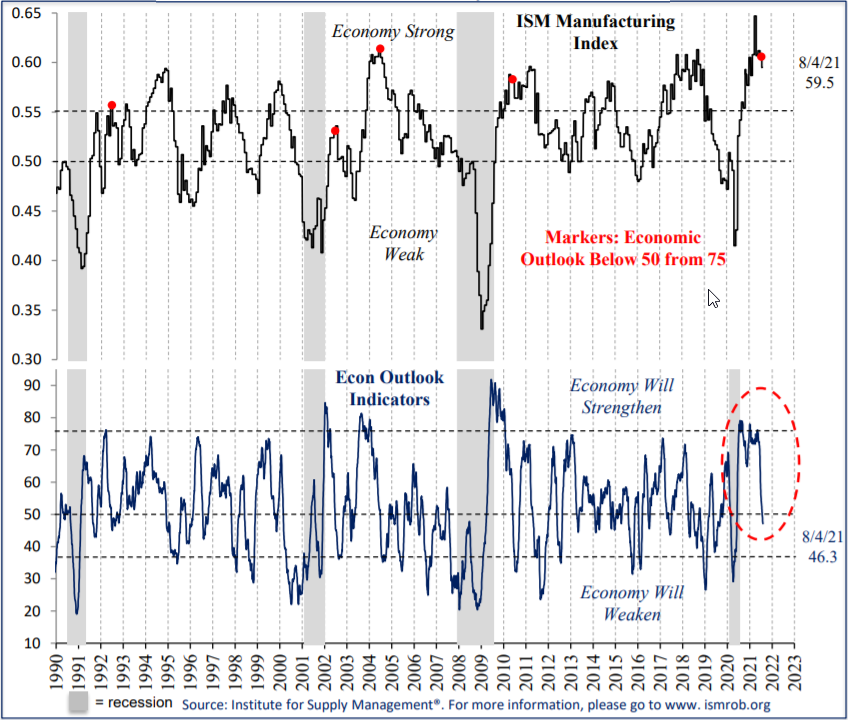
The U.S. ISM manufacturing index was down again in July to 59.5, down 5 points from the March peak of 64.7 as the reopening and fiscal stimulus fades. China’s PMI was down as well to 50.3 from the November peak of 54.9. Counter cyclical forces in China include the recent “regulatory tightening” of firms accessing foreign capital and loan growth turning negative in March. In the U.S., the Fed remains stimulative by any standard but the post COVID reopening burst and the record fiscal stimulus are fading, acting to slow growth rates and inflation.
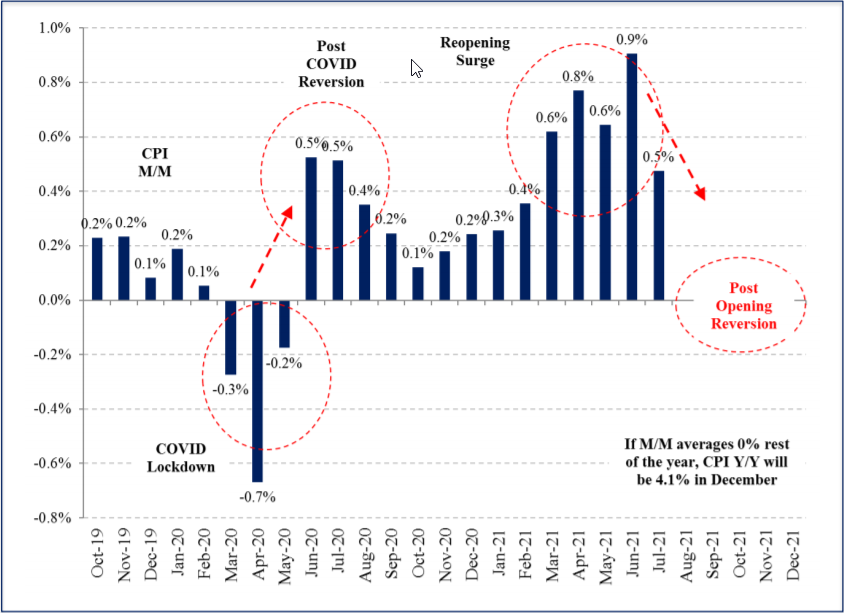
Prior U.S./China synchronized decelerations (2005, 2012, 2015 and 2019) demonstrate it is a typical post recession pattern. CPI inflation generally follows the economy lower as it did in the last three cases. The most dramatic was in 2012 when inflation slowed to 1.4% from 3.9% in 2011. As you would expect, the 10-year Treasury yield typically falls during these reversions as well. These decelerations did not end in recessions but lasted 12-18 months (Q1 or Q2 2022 in this case) and served to extend the business cycle by lowering inflation, postponing overheating and the inevitable Fed tightening.
U.S. Fiscal Spending Fading / Less Stimulus for U.S. Economy
China Aggregate Financing Contracting / Less Stimulus for Chinese Economy
CPI Inflation Reverting Lower after Reopening Surge
10-Year Yield Lower During Synchronized Slowdowns
Economic Outlook Lower: Mixed S&P 500 Returns
Aside from a synchronized U.S./China slow down, our economic outlook indicators also fell further this month to a low neutral 46 from a peak of 75 in March. Commodities like crude oil, copper and iron ore are trending lower together, consistent with slower growth ahead. The implications for investors are interesting. Since 1970, when the economic outlook was neutral and the economy was strong as it is now (ISM over 58), the S&P 500 returned -1.4% annualized, no disaster but 11% below the norm. However, once the economy and ISM index reversed lower to a neutral range between 48-58, the S&P 500 returned 11.9% annualized, almost 2% above the norm. In other words, expected returns are mixed until the economy slows, and it becomes obvious to investors. For now, it appears expectations are too high for strong returns ahead.
Economic Outlook Below 50 / Mid-Cycle Slowdown Ahead
Equity Returns Initially Mixed During Mid-Cycle Slowdowns
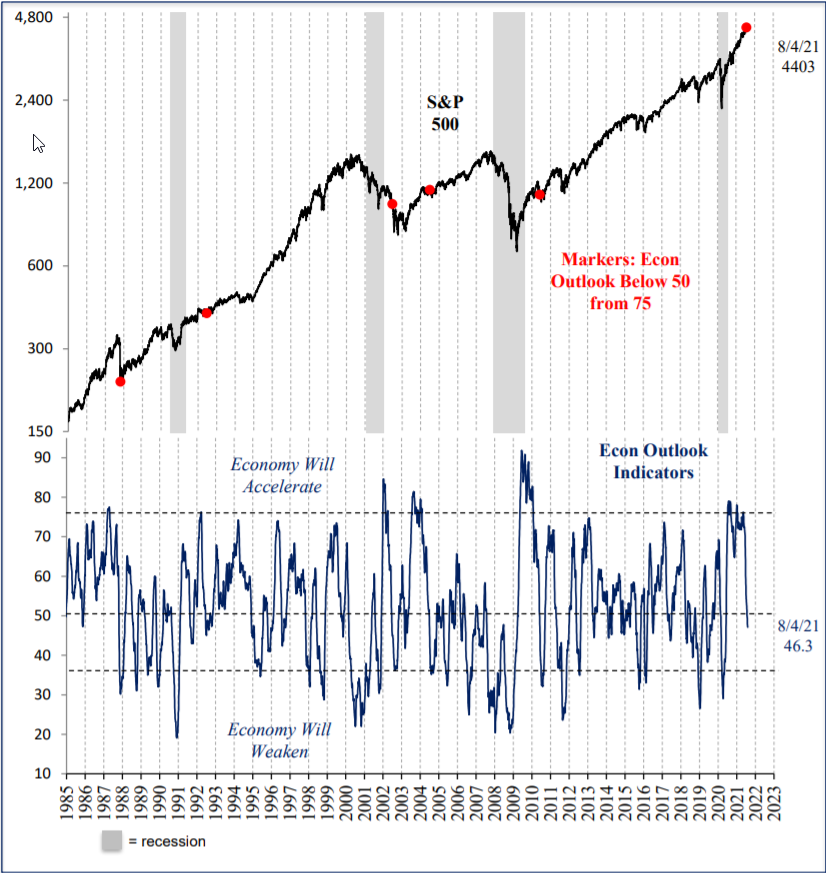
Strong S&P 500: Mixed Returns Ahead
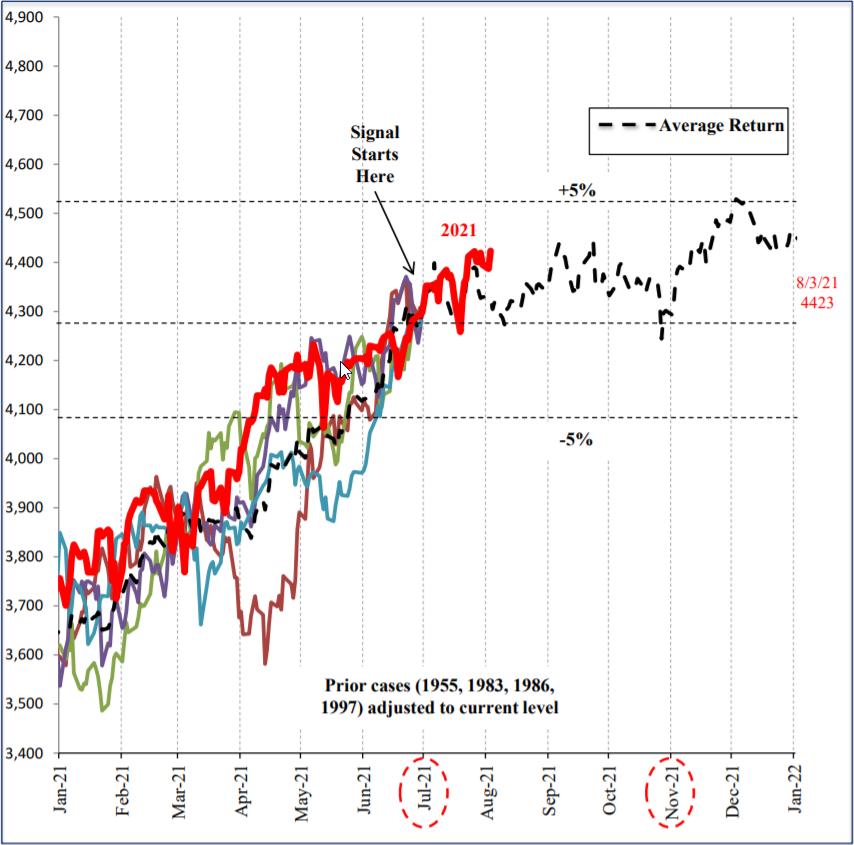
Last month we discussed the implications of the S&P 500 up 38% Y/Y through June. This chart shows the average return in prior cases was flat through the end of October. This would be consistent with mixed returns predicted ahead during mid-cycle slowdowns.
S&P 500 Up 38% Y/Y through June 4 Prior Cases were Flat July through October
Gold Down: Out of Favor
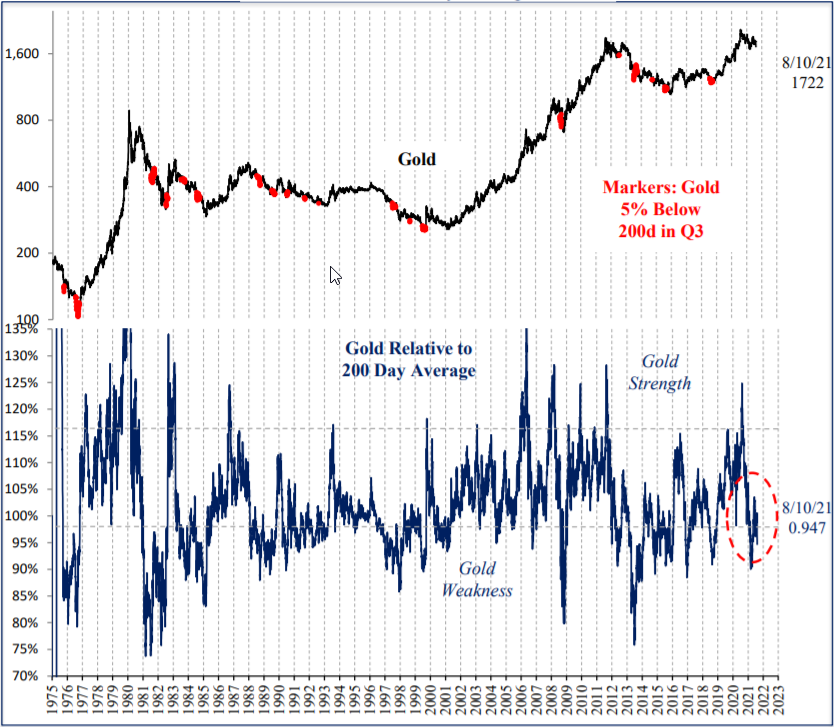
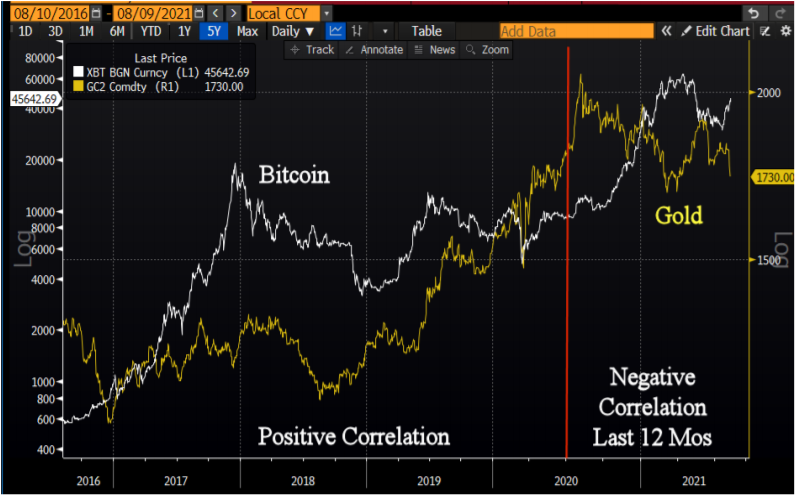
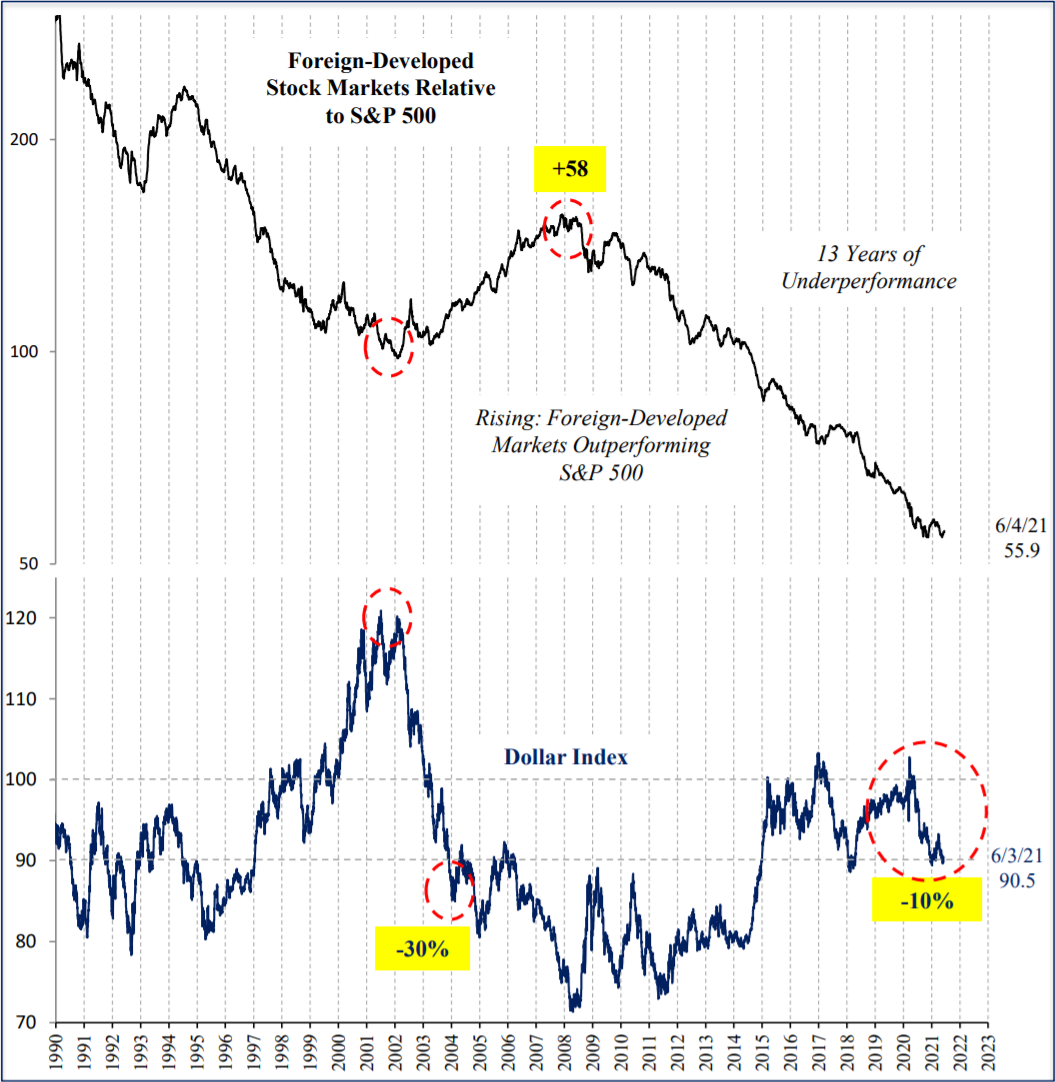
Gold is down 16% from the August peak of 2,058 and down 9.1% YTD. Investors are reacting to the likelihood of lower inflation ahead, possible Fed tapering at the upcoming Jackson Hole meeting, recent dollar strength and a reversal in Bitcoin. In the last 12 months Bitcoin and gold were inversely correlated. In other words when Bitcoin rallied, gold declined. Sentiment is one sided with 84% of futures trader’s bearish gold and 80% bullish bitcoin. A stronger dollar and bitcoin are risks for gold, but on the flipside, gold weakness is bullish historically. Since 1985, gold returned 11.9% (2x norm) when over 5% below the 200-day average as it is today. Ironically, the return was even higher at 17.3% (3x norm) when 5% below the 200 day and the Dollar Index was up 4% like it is today. The bigger long-term risk for U.S. portfolios is a decline in the Dollar due to unsustainable fiscal deficits and unprecedented central bank policy. We are maintaining our bullish 5 rating.
Gold 5% Below 200 Day Average: Positive
Bitcoin vs. Gold
Summary
While the boom phase of the economy has clear implications for asset prices, namely long equities and commodities and short bonds, the prospect of a mid-cycle economic slowdown has more mixed and subtle implications. To this point we have pulled ratings in equities, commodities and bonds toward neutral until probabilities are stronger in one direction or the other. Since the length of mid-cycle slowdowns are never identical, we will watch indicators closely for the next move. Thank you for your support and please contact your advisor with any questions.
IMPORTANT DISCLOSURES
This review and outlook report (this “Report”) is for informational, illustration and discussion purposes only and is not intended to be, nor should it be construed as, financial, legal, tax or investment advice, of Brenton Point Wealth Advisors LLC or any of its affiliates (“Brenton Point”). This Report does not take into account the investment objectives, financial situation, restrictions, particular needs or financial, legal or tax situation of any particular person and should not be viewed as addressing any recipient’s particular investment needs. Recipients should consider the information contained in this Report as only a single factor in making an investment decision and should not rely solely on investment recommendations contained herein, if any, as a substitution for the exercise of independent judgment of the merits and risks of investments.
This material is based upon information obtained from various sources that Brenton Point believes to be reliable, but Brenton Point makes no representation or warranty with respect to the accuracy or completeness of such information. Views expressed herein are current only as of the date indicated and are subject to change without notice.
This Report contains certain forward looking statements opinions, estimates, projections, assessments and other views (collectively “Statements”). These Statements are subject to a number of assumptions, risks and uncertainties which may cause actual results, performance or achievements to be materially different from future results, performance or achievements expressed or implied by these forward looking statements and projections. Brenton Point makes no representations as to the reasonableness of such assumptions or the likelihood that such assumptions will coincide with actual events and this information should not be relied upon for that purpose. Changes in such assumptions could produce materially different results. Past performance is not a guarantee or indication of future results, and no representation or warranty, express or implied, is made regarding future performance of any financial instrument mentioned in this Report.
Any benchmark shown herein is shown for illustrative purposes only. No index benchmark is available for direct investment. It may not be possible to replicate the returns of any index, as the index may not include any trading commissions and costs or fees, may assume the reinvestment of income, and may have investment objectives, use trading strategies, or have other materials characteristics, such as credit exposure or volatility, that do not make it suitable for a particular person. This is not an offer or solicitation for the purchase or sale of any security, investment, or other product and should not be construed as such. References to specific financial instruments and to certain indices are for illustrative purposes only and provided for the purpose of making general market data available as a point of reference only; they are not intended to be, and should not be interpreted as recommendations to purchase or sell such securities. Investing in securities and other financial products entails certain risks, including the possible loss of the entire principal amount invested, as the value of investment can go down as well as up. You should obtain advice from your tax, financial, legal, and other advisors and only make investment decisions on the basis of your own objectives, experience, and resources.
Brenton Point accepts no liability for any loss (whether direct, indirect or consequential) occasioned to any person acting or refraining from action as a result of any material contained in or derived from this Report, except to the extent (but only to the extent) that such liability may not be waived, modified or limited under applicable law.
This Report may provide addresses of, or contain hyperlinks to, Internet websites. Brenton Point has not reviewed the linked Internet website of any third party and takes no responsibility for the contents thereof. Each such address or hyperlink is provided solely for your convenience and information, and the content of linked third party websites is not in any way incorporated herein. Recipients who choose to access such third-party websites or follow such hyperlinks do so at their own risk.
All marks referenced herein are the property of their respective owners. This Report is licensed for non-commercial use only, and may not be reproduced, distributed, forwarded, posted, published, transmitted, uploaded or otherwise made available to others for commercial purposes, including to individuals within an institution, without written authorization from Brenton Point.
Source of data and performance statistics: Bloomberg L.P. and Factset Research Systems Inc.
©Brenton Point Wealth Advisors LLC 2021

Michael Schaus
Director of Market Research
Michael Schaus is the Director of Market Research for Brenton Point Wealth Advisors and Zweig-DiMenna. Since joining Zweig-DiMenna in 1992, his focus has been on macroeconomic research, the analysis of…
READ MORE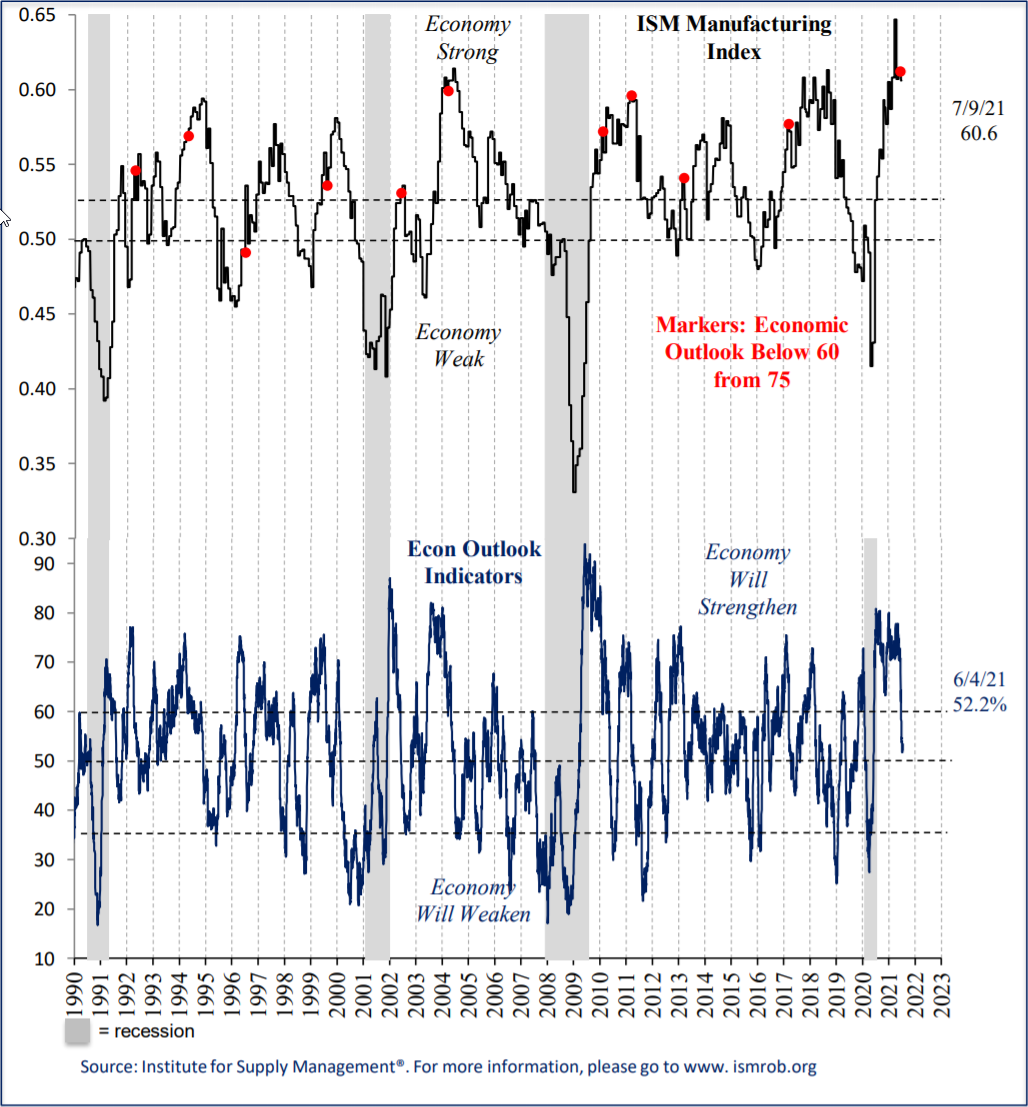
Sign up!
Sign up for our monthly newsletter and get the lastest news and research from our esteemed advisors here at Brenton point. Right into your inbox!