 Client Login

Virus Containment
Stopping the spread of COVID-19 is an urgent priority for our health and the economy. We are seeing progress and are hopeful government resources will solve the issue. The record amount of stimulus from the Federal Reserve and Congress will not necessarily get people back to work, but in prior cases, the Fed and Congress acting together were bullish for both the economy and the stock market. Finally, past patterns around both the worst GDP quarters and S&P 500 declines suggest a neutral exposure to stocks (not altering one’s allocation) is appropriate for a consolidation phase.
As Larry Summers, the former Treasury Secretary said this week, the economic outcome will be determined by our success in stopping the disease. And nothing is more urgent. To state the obvious, until the disease is stopped, the economy cannot recover.
Step One: Virus Containment
There is evidence the virus will be contained. The most important is that world, state and local governments are finally focused on the issue with all resources available. Although U.S. cases are still rising, experts expect a peak in new cases within two weeks. Some countries are showing progress. New cases are down in the last 5 days in Spain, S. Korea, Switzerland, Australia and Mexico. Please keep in mind all these numbers will be inaccurate until testing is widely available. The good news is more people are recovering every day, and by most accounts they will be immune going forward. When it comes, the peak in the number of new cases per day will shift the thinking towards recovery.
Chart 1: Global Covid-19 Cases by Country – Population Adjusted

Federal Reserve and Fiscal Stimulus: Unprecedented
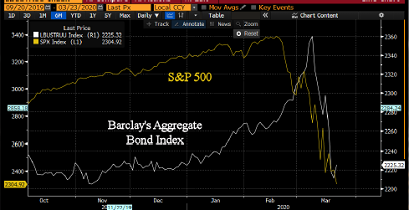
The Federal Reserve support of the economy through bond purchases is unprecedented. We mentioned Fed Chair Powell’s Today Show interview last week, saying the Fed would not run out of ammunition. He was not kidding. This week the Fed purchased $435 billion of securities and $924 billion in the last 4 weeks, 4.2% of GDP. For comparison, in 2009 the prior biggest single week of purchases was $175 billion and biggest 4 week total was $210 billion. Although Fed purchases of bonds will not necessarily get people back to work and restart the economy, it effectively halted the bond panic that threatened the economy beyond the virus. It will go a long way to funding markets to operate, allowing companies to maintain their operations. The best indication of this is the reversal in the price of bonds for high yield, leveraged companies. In a positive sign, the high yield spread reversed below 10% compared to a high of 20% in 2008. Combined with the fiscal spending bill of $2.2 trillion at 9.5% of GDP, it marks the full commitment of the government to turn the economy. Although we must stop the virus first, this amount of stimulus is positive for the economy and the stock market. It marked the low in 2008 as well as in 1932. And the Fed’s QE unlimited announcement on March 23rd appears to have spurred the 17.6% rally last week.
Chart 2: Fed Easing Unprecedented and Bullish: Over 4x the 2008 Rate

Chart 3: Fed QE Unlimited Announcement March 23rd: Low Point before 17.6% 3 Day Rally

The Economic Cycle in 2020
Where we are in the economic cycle is crucial in determining the expected return for stocks. This cycle was already unusual for the record low interest rates, central bank activity, and record length, but the COVID-19 pandemic stock market crash and recession makes this cycle unique. For instance, the record number of unemployment claims reported on Thursday means the unemployment rate likely grew to over 10% in just one month’s time, which was the peak from during 2008 global financial crisis. It confirms a recession has likely already begun. The question now is when will the recession end, since stocks always turn higher beforehand. Although the timing is still unclear, it is important to understand the virus will be beaten, which will lead to an economic rebound.
Chart 4: Unemployment Rate Estimated at 10%: 1928 – 2020

S&P 500 Declines Precede Economic Weakness
Given the anecdotal evidence and sharp rise in unemployment, it is clear the second quarter (from April to June) will show a sharply negative GDP reading. The question is what are the implications for the stock market. To find out, we looked at the 7 worst GDP quarters since 1947. It turns out the worst S&P 500 returns were in the month before the quarter even started. 5 of 7 prior cases were down an average of 4.2%. In other words, the 12.5% S&P 500 decline in March is typical, since the stock market anticipates economic moves ahead. Returns were mixed in the first two months of the negative quarter and strongest in the final month (June in this case). It supports the possibility that the worst stock market declines are potentially behind us. The Blue Chip survey of economists shows -15.9% expected for Q2 GDP and a rebound to 3.1% in Q3. That may be too optimistic, since it will take time to get people back to work and repair the economic damage.
Monthly S&P 500 Returns around GDP Quarters Down >5% since 1947

Chart 5: Monthly S&P 500 Returns Around Negative 5% GDP Quarters Stocks Decline PRIOR to the Economic Weakness

Chart 6: Blue Chip Survey of Economists – 4/1/20

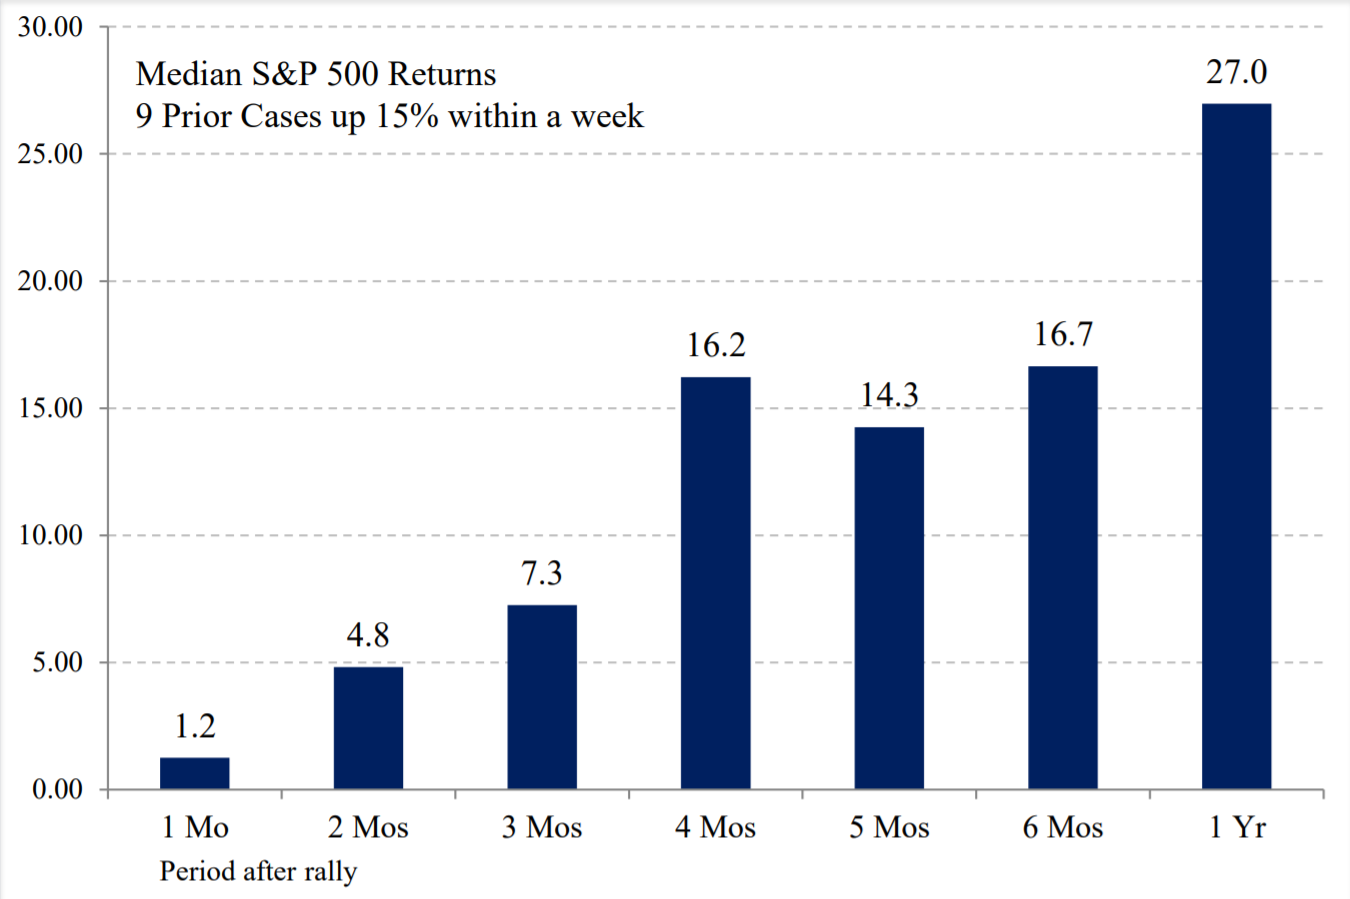
Prior Crash Patterns: Patience for a Good Entry Point
Prior crashes show a typical pattern driven by the emotions of investors. The 3 day 17.6% rally was a normal “relief” rally from oversold conditions. What typically follows is 1-2 months of consolidation in a trading range. The first rally is rarely a time to add exposure. It will take patience to wait for a better entry point, since typically stocks go lower as the weak economic news is reported. We will be watching carefully for an opportunity, since stocks will turn higher before the economy.
In summary, We are maintaining our neutral 3 rating for U.S. and Developed foreign stocks. We raised Emerging Markets stocks to a bullish 5 rating last week. Long-term bonds remain a negative 2 rating based on the low level of yields and downside risk. Gold remains a bullish 5 rating. Stopping the spread of COVID-19 remains the top priority, but we are confident it will be solved. During that time we can expect further negative headlines as the human toll and economic damage is revealed. However, past negative GDP patterns and crashes show we can expect a period of consolidation when there may be an opportunity to add equity exposure. Once the virus spread is solved, the record amount of Federal Reserve and Fiscal stimulus makes a recovery more likely, so we are optimistic. We will be watching the debt markets carefully.
Thank you for your support and please contact your advisor with any questions.


IMPORTANT DISCLOSURES
This review and outlook report (this “Report”) is for informational, illustration and discussion purposes only and is not intended to be, nor should it be construed as, financial, legal, tax or investment advice, of Brenton Point Wealth Advisors LLC or any of its affiliates (“Brenton Point”). This Report does not take into account the investment objectives, financial situation, restrictions, particular needs or financial, legal or tax situation of any particular person and should not be viewed as addressing any recipient’s particular investment needs. Recipients should consider the information contained in this Report as only a single factor in making an investment decision and should not rely solely on investment recommendations contained herein, if any, as a substitution for the exercise of independent judgment of the merits and risks of investments.
This material is based upon information obtained from various sources that Brenton Point believes to be reliable, but Brenton Point makes no representation or warranty with respect to the accuracy or completeness of such information. Views expressed herein are current only as of the date indicated and are subject to change without notice.
This Report contains certain forward looking statements opinions, estimates, projections, assessments and other views (collectively “Statements”). These Statements are subject to a number of assumptions, risks and uncertainties which may cause actual results, performance or achievements to be materially different from future results, performance or achievements expressed or implied by these forward looking statements and projections. Brenton Point makes no representations as to the reasonableness of such assumptions or the likelihood that such assumptions will coincide with actual events and this information should not be relied upon for that purpose. Changes in such assumptions could produce materially different results. Past performance is not a guarantee or indication of future results, and no representation or warranty, express or implied, is made regarding future performance of any financial instrument mentioned in this Report.
Any benchmark shown herein is shown for illustrative purposes only. No index benchmark is available for direct investment. It may not be possible to replicate the returns of any index, as the index may not include any trading commissions and costs or fees, may assume the reinvestment of income, and may have investment objectives, use trading strategies, or have other materials characteristics, such as credit exposure or volatility, that do not make it suitable for a particular person. This is not an offer or solicitation for the purchase or sale of any security, investment, or other product and should not be construed as such. References to specific financial instruments and to certain indices are for illustrative purposes only and provided for the purpose of making general market data available as a point of reference only; they are not intended to be, and should not be interpreted as recommendations to purchase or sell such securities. Investing in securities and other financial products entails certain risks, including the possible loss of the entire principal amount invested, as the value of investment can go down as well as up. You should obtain advice from your tax, financial, legal, and other advisors and only make investment decisions on the basis of your own objectives, experience, and resources.
Brenton Point accepts no liability for any loss (whether direct, indirect or consequential) occasioned to any person acting or refraining from action as a result of any material contained in or derived from this Report, except to the extent (but only to the extent) that such liability may not be waived, modified or limited under applicable law.
This Report may provide addresses of, or contain hyperlinks to, Internet websites. Brenton Point has not reviewed the linked Internet website of any third party and takes no responsibility for the contents thereof. Each such address or hyperlink is provided solely for your convenience and information, and the content of linked third party websites is not in any way incorporated herein. Recipients who choose to access such third-party websites or follow such hyperlinks do so at their own risk.
All marks referenced herein are the property of their respective owners. This Report is licensed for non-commercial use only, and may not be reproduced, distributed, forwarded, posted, published, transmitted, uploaded or otherwise made available to others for commercial purposes, including to individuals within an institution, without written authorization from Brenton Point.
Source of data and performance statistics: Bloomberg L.P. and Factset Research Systems Inc.
©Brenton Point Wealth Advisors LLC 2020

Michael Schaus
Director of Market Research
Michael Schaus is the Director of Market Research for Brenton Point Wealth Advisors and Zweig-DiMenna. Since joining Zweig-DiMenna in 1992, his focus has been on macroeconomic research, the analysis of…
READ MORERead Next:
Sign up!
Sign up for our monthly newsletter and get the lastest news and research from our esteemed advisors here at Brenton point. Right into your inbox!